Grove Results Presentation Deck
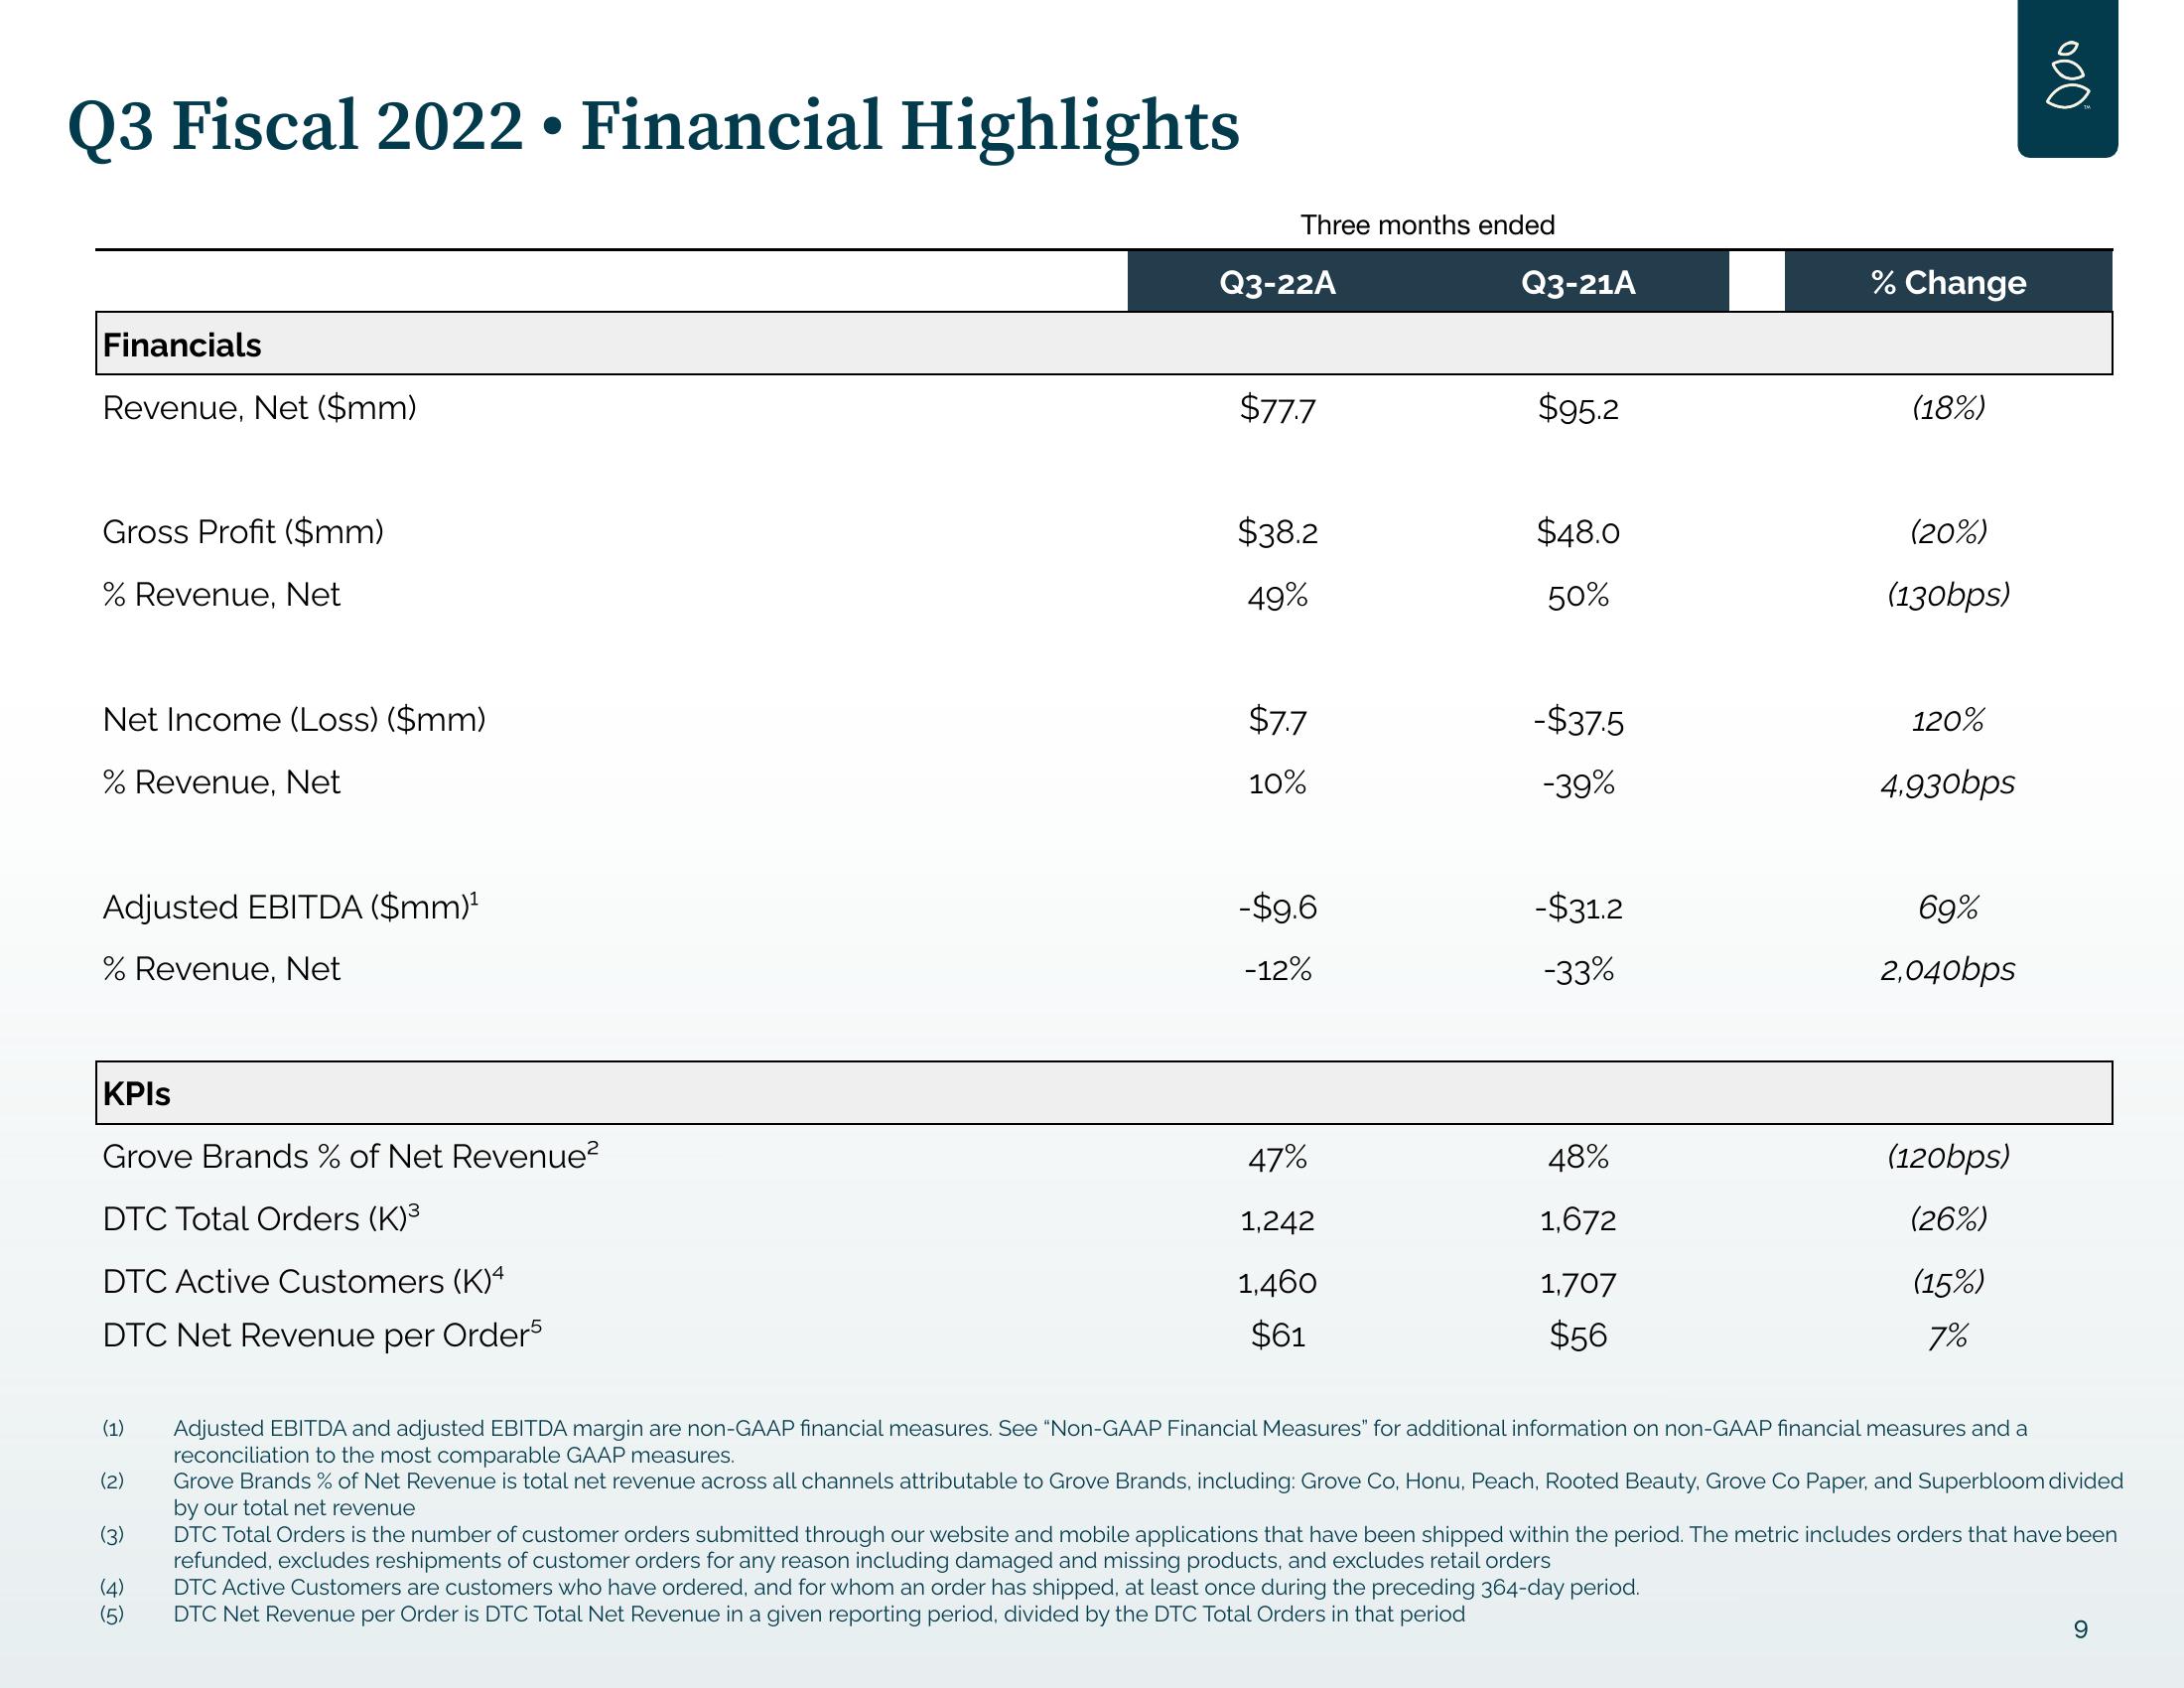
Q3 Fiscal 2022 • Financial Highlights
Financials
Revenue, Net ($mm)
Gross Profit ($mm)
% Revenue, Net
Net Income (Loss) ($mm)
% Revenue, Net
Adjusted EBITDA ($mm)¹
% Revenue, Net
KPIs
Grove Brands % of Net Revenue²
DTC Total Orders (K)³
DTC Active Customers (K)4
DTC Net Revenue per Order5
(1)
(2)
(3)
(4)
(5)
Three months ended
Q3-22A
$77.7
$38.2
49%
$7.7
10%
-$9.6
-12%
47%
1,242
1,460
$61
Q3-21A
$95.2
$48.0
50%
-$37.5
-39%
-$31.2
-33%
48%
1,672
1,707
$56
% Change
(18%)
(20%)
(130bps)
120%
4.930bps
69%
2,040bps
(120bps)
(26%)
(15%)
7%
000
Adjusted EBITDA and adjusted EBITDA margin are non-GAAP financial measures. See "Non-GAAP Financial Measures" for additional information on non-GAAP financial measures and a
reconciliation to the most comparable GAAP measures.
Grove Brands % of Net Revenue is total net revenue across all channels attributable to Grove Brands, including: Grove Co, Honu, Peach, Rooted Beauty, Grove Co Paper, and Superbloom divided
by our total net revenue
DTC Total Orders is the number of customer orders submitted through our website and mobile applications that have been shipped within the period. The metric includes orders that have been
refunded, excludes reshipments of customer orders for any reason including damaged and missing products, and excludes retail orders
DTC Active Customers are customers who have ordered, and for whom an order has shipped, at least once during the preceding 364-day period.
DTC Net Revenue per Order is DTC Total Net Revenue in a given reporting period, divided by the DTC Total Orders in that period
9View entire presentation