Pathward Financial Investor Presentation Deck slide image

Pathward Financial Investor Presentation Deck

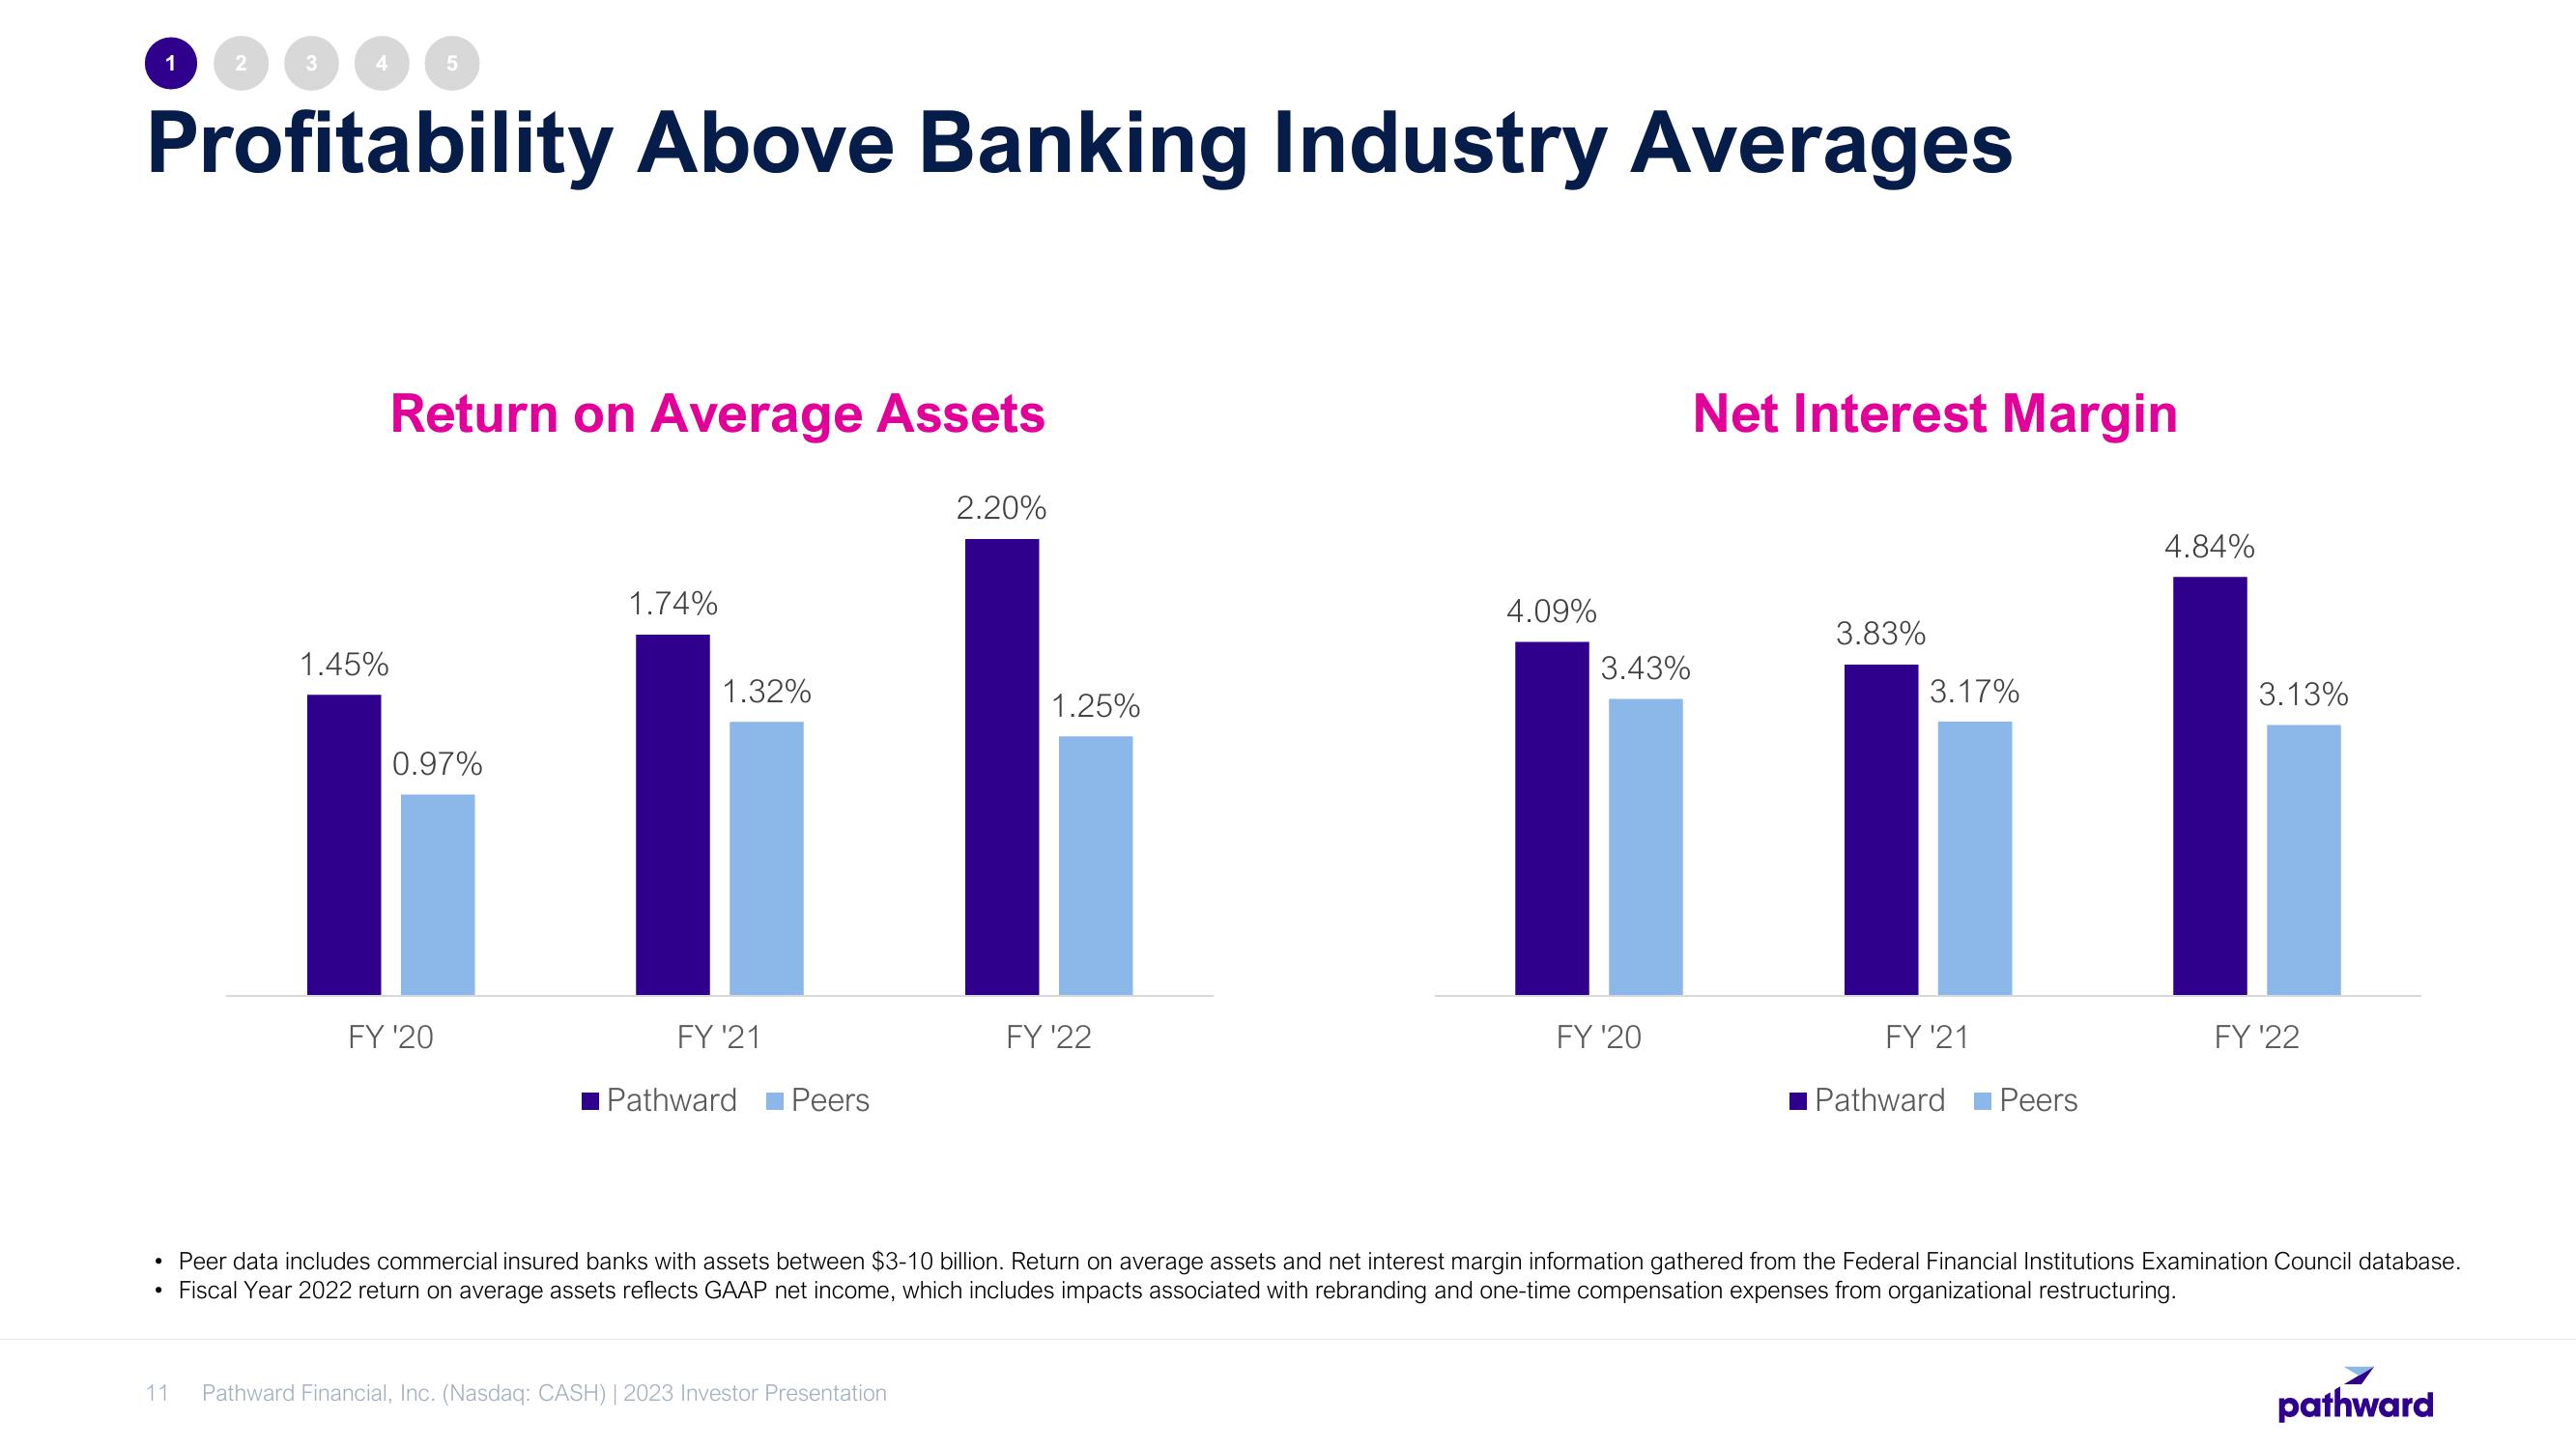
ā— 1 ā€¢ 2 Profitability Above Banking Industry Averages 11 3 4 1.45% Return on Average Assets 0.97% FY '20 1.74% 1.32% FY '21 Pathward Peers 2.20% Pathward Financial, Inc. (Nasdaq: CASH) | 2023 Investor Presentation 1.25% FY '22 4.09% 3.43% FY '20 Net Interest Margin 3.83% 3.17% FY '21 Pathward Peers 4.84% 3.13% FY '22 Peer data includes commercial insured banks with assets between $3-10 billion. Return on average assets and net interest margin information gathered from the Federal Financial Institutions Examination Council database. Fiscal Year 2022 return on average assets reflects GAAP net income, which includes impacts associated with rebranding and one-time compensation expenses from organizational restructuring. pathward
View entire presentation