Evercore Investment Banking Pitch Book
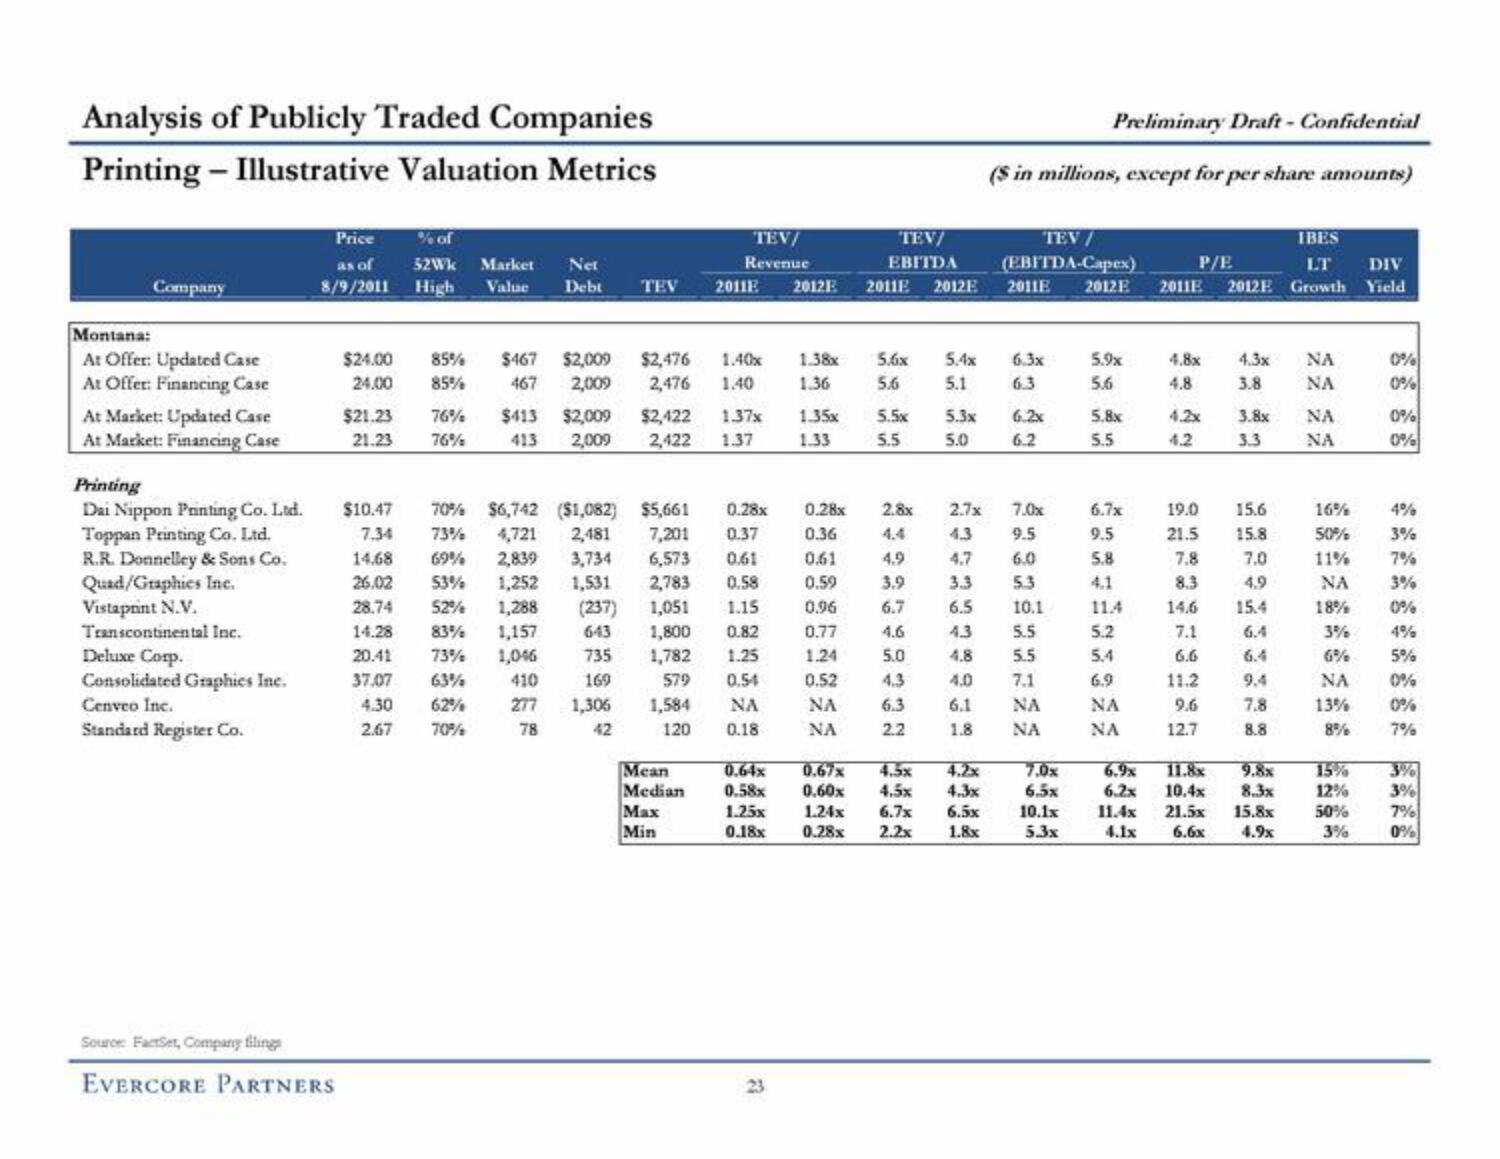
Analysis of Publicly Traded Companies
Printing - Illustrative Valuation Metrics
Company
Montana:
At Offer: Updated Case
At Offer: Financing Case
At Market: Updated Case
At Market: Financing Case
Printing
Dai Nippon Printing Co. Ltd.
Toppan Printing Co. Ltd.
R.R. Donnelley & Sons Co.
Quad/Graphies Inc.
Vistaprint N.V.
Transcontinental Inc.
Deluxe Corp.
Consolidated Graphics Inc.
Cenveo Inc.
Standard Register Co.
Price
as of
8/9/2011
Source: FactSet, Company filings
EVERCORE PARTNERS
$24.00
24.00
$21.23
21.23
$10.47
7.34
14.68
26.02
28.74
14.28
20.41
37.07
4.30
2.67
% of
52Wk Market
High Value
Net
Debt
85%
$467
85% 467 2,009
76% $413 $2,009
76%
413 2,009
TEV
3,734
1,531
$2,009 $2,476 1.40x
70% $6,742 ($1,082) $5,661
73% 4,721 2,481
69% 2,839
53% 1,252
52% 1,288
83% 1,157
73% 1,046
63%
410
62%
277
70%
78
TEV/
Revenue
(237)
643 1,800
735
1,782
169
579
1,306
42
2011E
1,584
120
7,201 0.37
6,573
0.61
2,783
0.58
1,051
1.15
0.82
1.25
0.54
NA
0.18
Mean
Median
Max
Min
1.38x
2,476 1.40
1.36
5.6
$2,422 1.37x 1.35x 5.5x
2,422 1.37 1.33 5.5
0.64x
0.58x
2012E
1.25x
0.18x
TEV/
EBITDA
0.28x 0.28x 2.8x
0.36
0.61
0.59
0.96
0.77
1.24
0.52
NA
NA
33
2011E 2012E
5.6x 5.4x 6.3x
5.1 6.3
5.3x
6.2x
5.0
6.2
4.9
3.9
6.7
4.6
5.0
4.3
6.3
2.2
Preliminary Draft - Confidential
($ in millions, except for per share amounts)
TEV /
(EBITDA-Capex)
0.67x 4.5x
0.60x
4.5x
124x
6.7x 6.5x
0.28x
2.2x
1.8x
2011E
2.7x
7.0x
4.3
9.5
4.7
6.0
3.3
5.3
6.5
10.1
4.3
5.5
4.8
5.5
4.0 7.1
6.1 NA
1.8
ΝΑ
7.0x
6.5x
10.1x
5.3x
2012 E
5.9x
5.6
5.8x
5.5
6.7x
9.5
5.8
4.1
11.4
5.2
5.4
6.9
NA
NA
IBES
LT DIV
2011E 2012E Growth Yield
P/E
4.8x
4.8
4.2x
4.2
4.3x
NA
3.8 NA
6.9x
6.2x 10.4x
11.4x 25
4.1x 6.6x
3.8x
3.3
19.0 15.6
21.5
15.8
7.8
7.0
8.3
4.9
14.6
15.4
7.1
6.4
6.6
6.4
11.2
9.4
9.6
7.8
12.7
8.8
11.8x 9.8x
8.3x
15.8x
4.9x
NA
NA
16%
50%
11%
NA
18%
3%
6%
NA
13%
8%
15%
12%
50%
3%
0%
0%
0%
0%
4%
3%
7%
3%
0%
4%
5%
0%
0%
7%
3%
3%
7%
0%View entire presentation