Avantor Investor Conference Presentation Deck
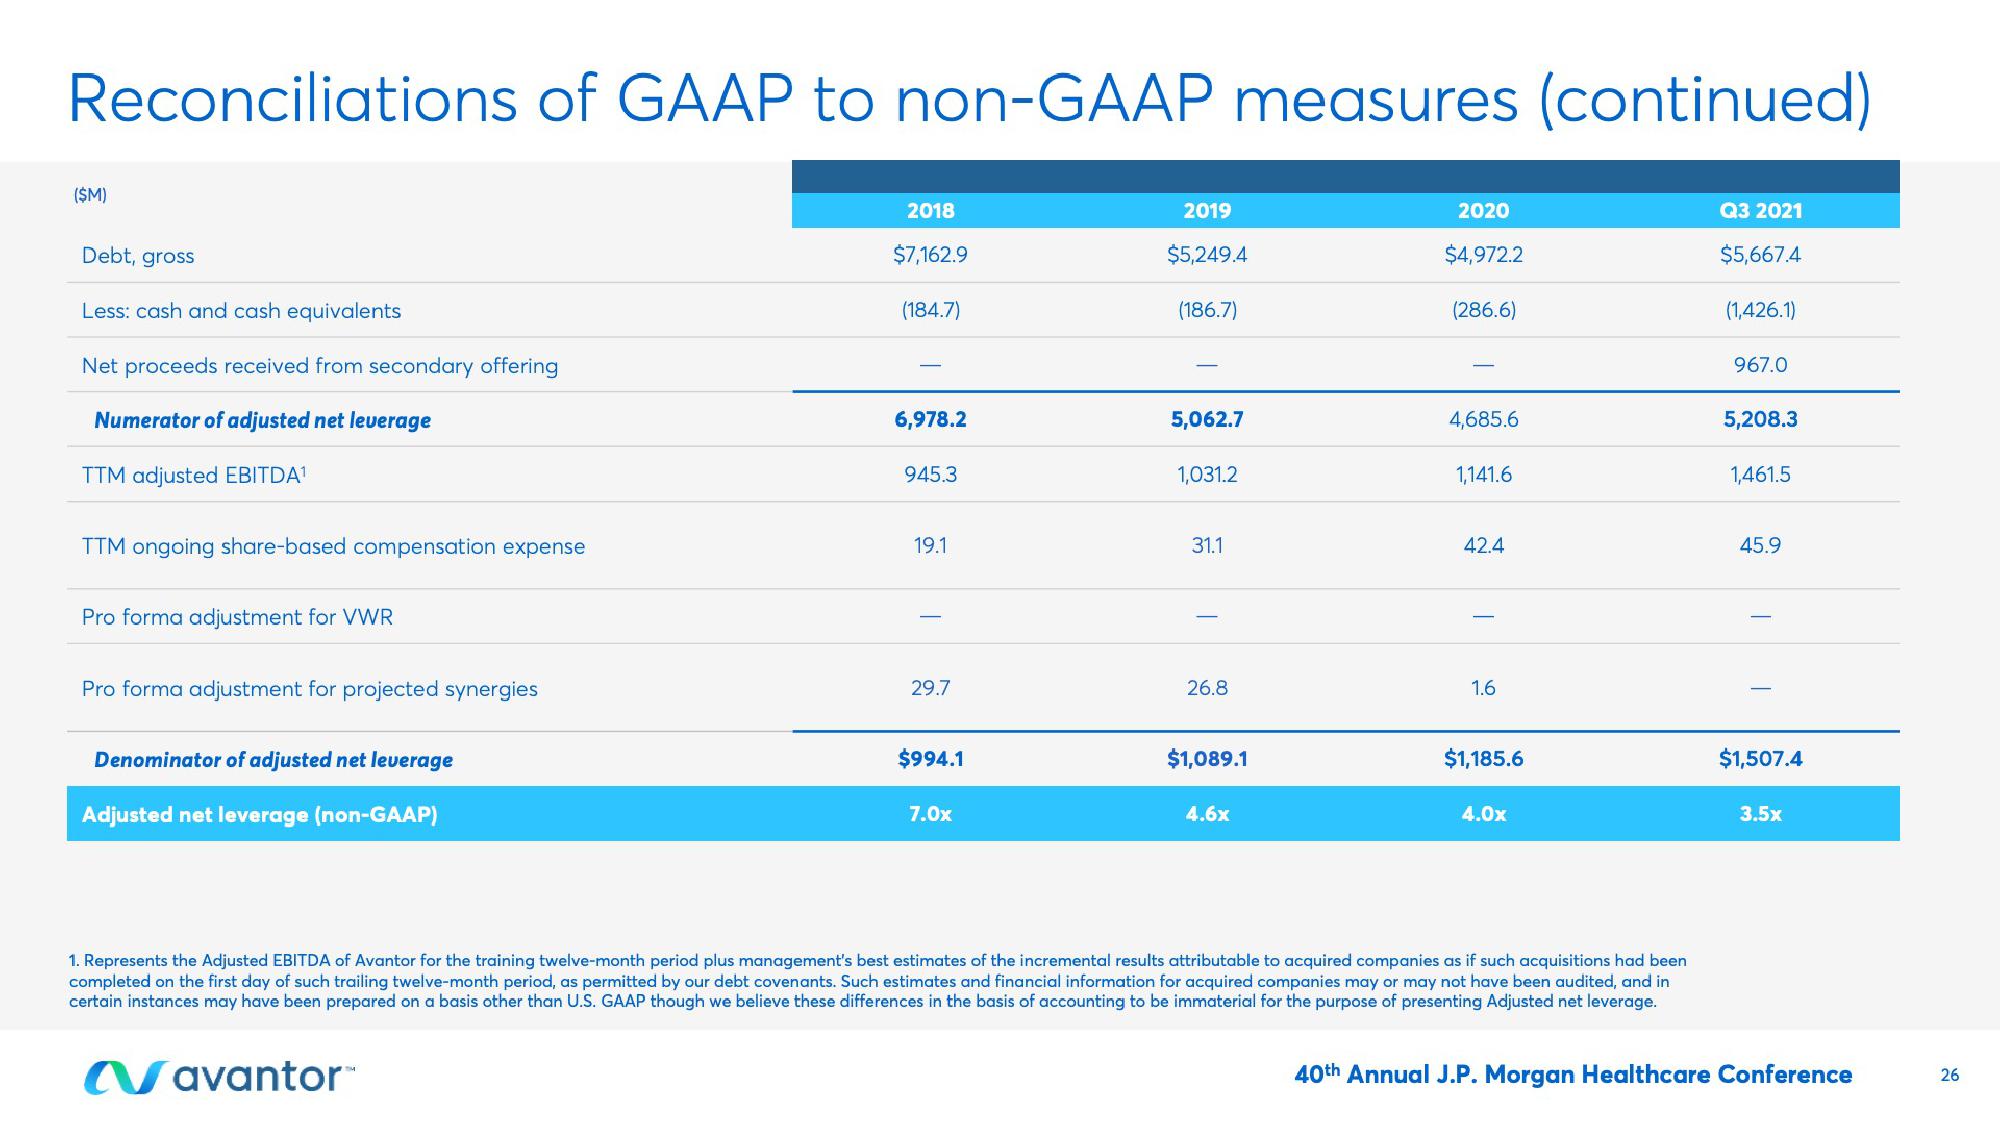
Reconciliations of GAAP to non-GAAP measures (continued)
($M)
Debt, gross
Less: cash and cash equivalents
Net proceeds received from secondary offering
Numerator of adjusted net leverage
TTM adjusted EBITDA¹
TTM ongoing share-based compensation expense
Pro forma adjustment for VWR
Pro forma adjustment for projected synergies
Denominator of adjusted net leverage
Adjusted net leverage (non-GAAP)
2018
$7,162.9
(184.7)
6,978.2
945.3
19.1
29.7
$994.1
7.0x
2019
$5,249.4
(186.7)
5,062.7
1,031.2
31.1
26.8
$1,089.1
4.6x
2020
$4,972.2
(286.6)
4,685.6
1,141.6
42.4
1.6
$1,185.6
4.0x
1. Represents the Adjusted EBITDA of Avantor for the training twelve-month period plus management's best estimates of the incremental results attributable to acquired companies as if such acquisitions had been
completed on the first day of such trailing twelve-month period, as permitted by our debt covenants. Such estimates and financial information for acquired companies may or may not have been audited, and in
certain instances may have been prepared on a basis other than U.S. GAAP though we believe these differences in the basis of accounting to be immaterial for the purpose of presenting Adjusted net leverage.
Navantor™
Q3 2021
$5,667.4
(1,426.1)
967.0
5,208.3
1,461.5
45.9
$1,507.4
3.5x
40th Annual J.P. Morgan Healthcare Conference
26View entire presentation