Bank of America Investment Banking Pitch Book
Appendix
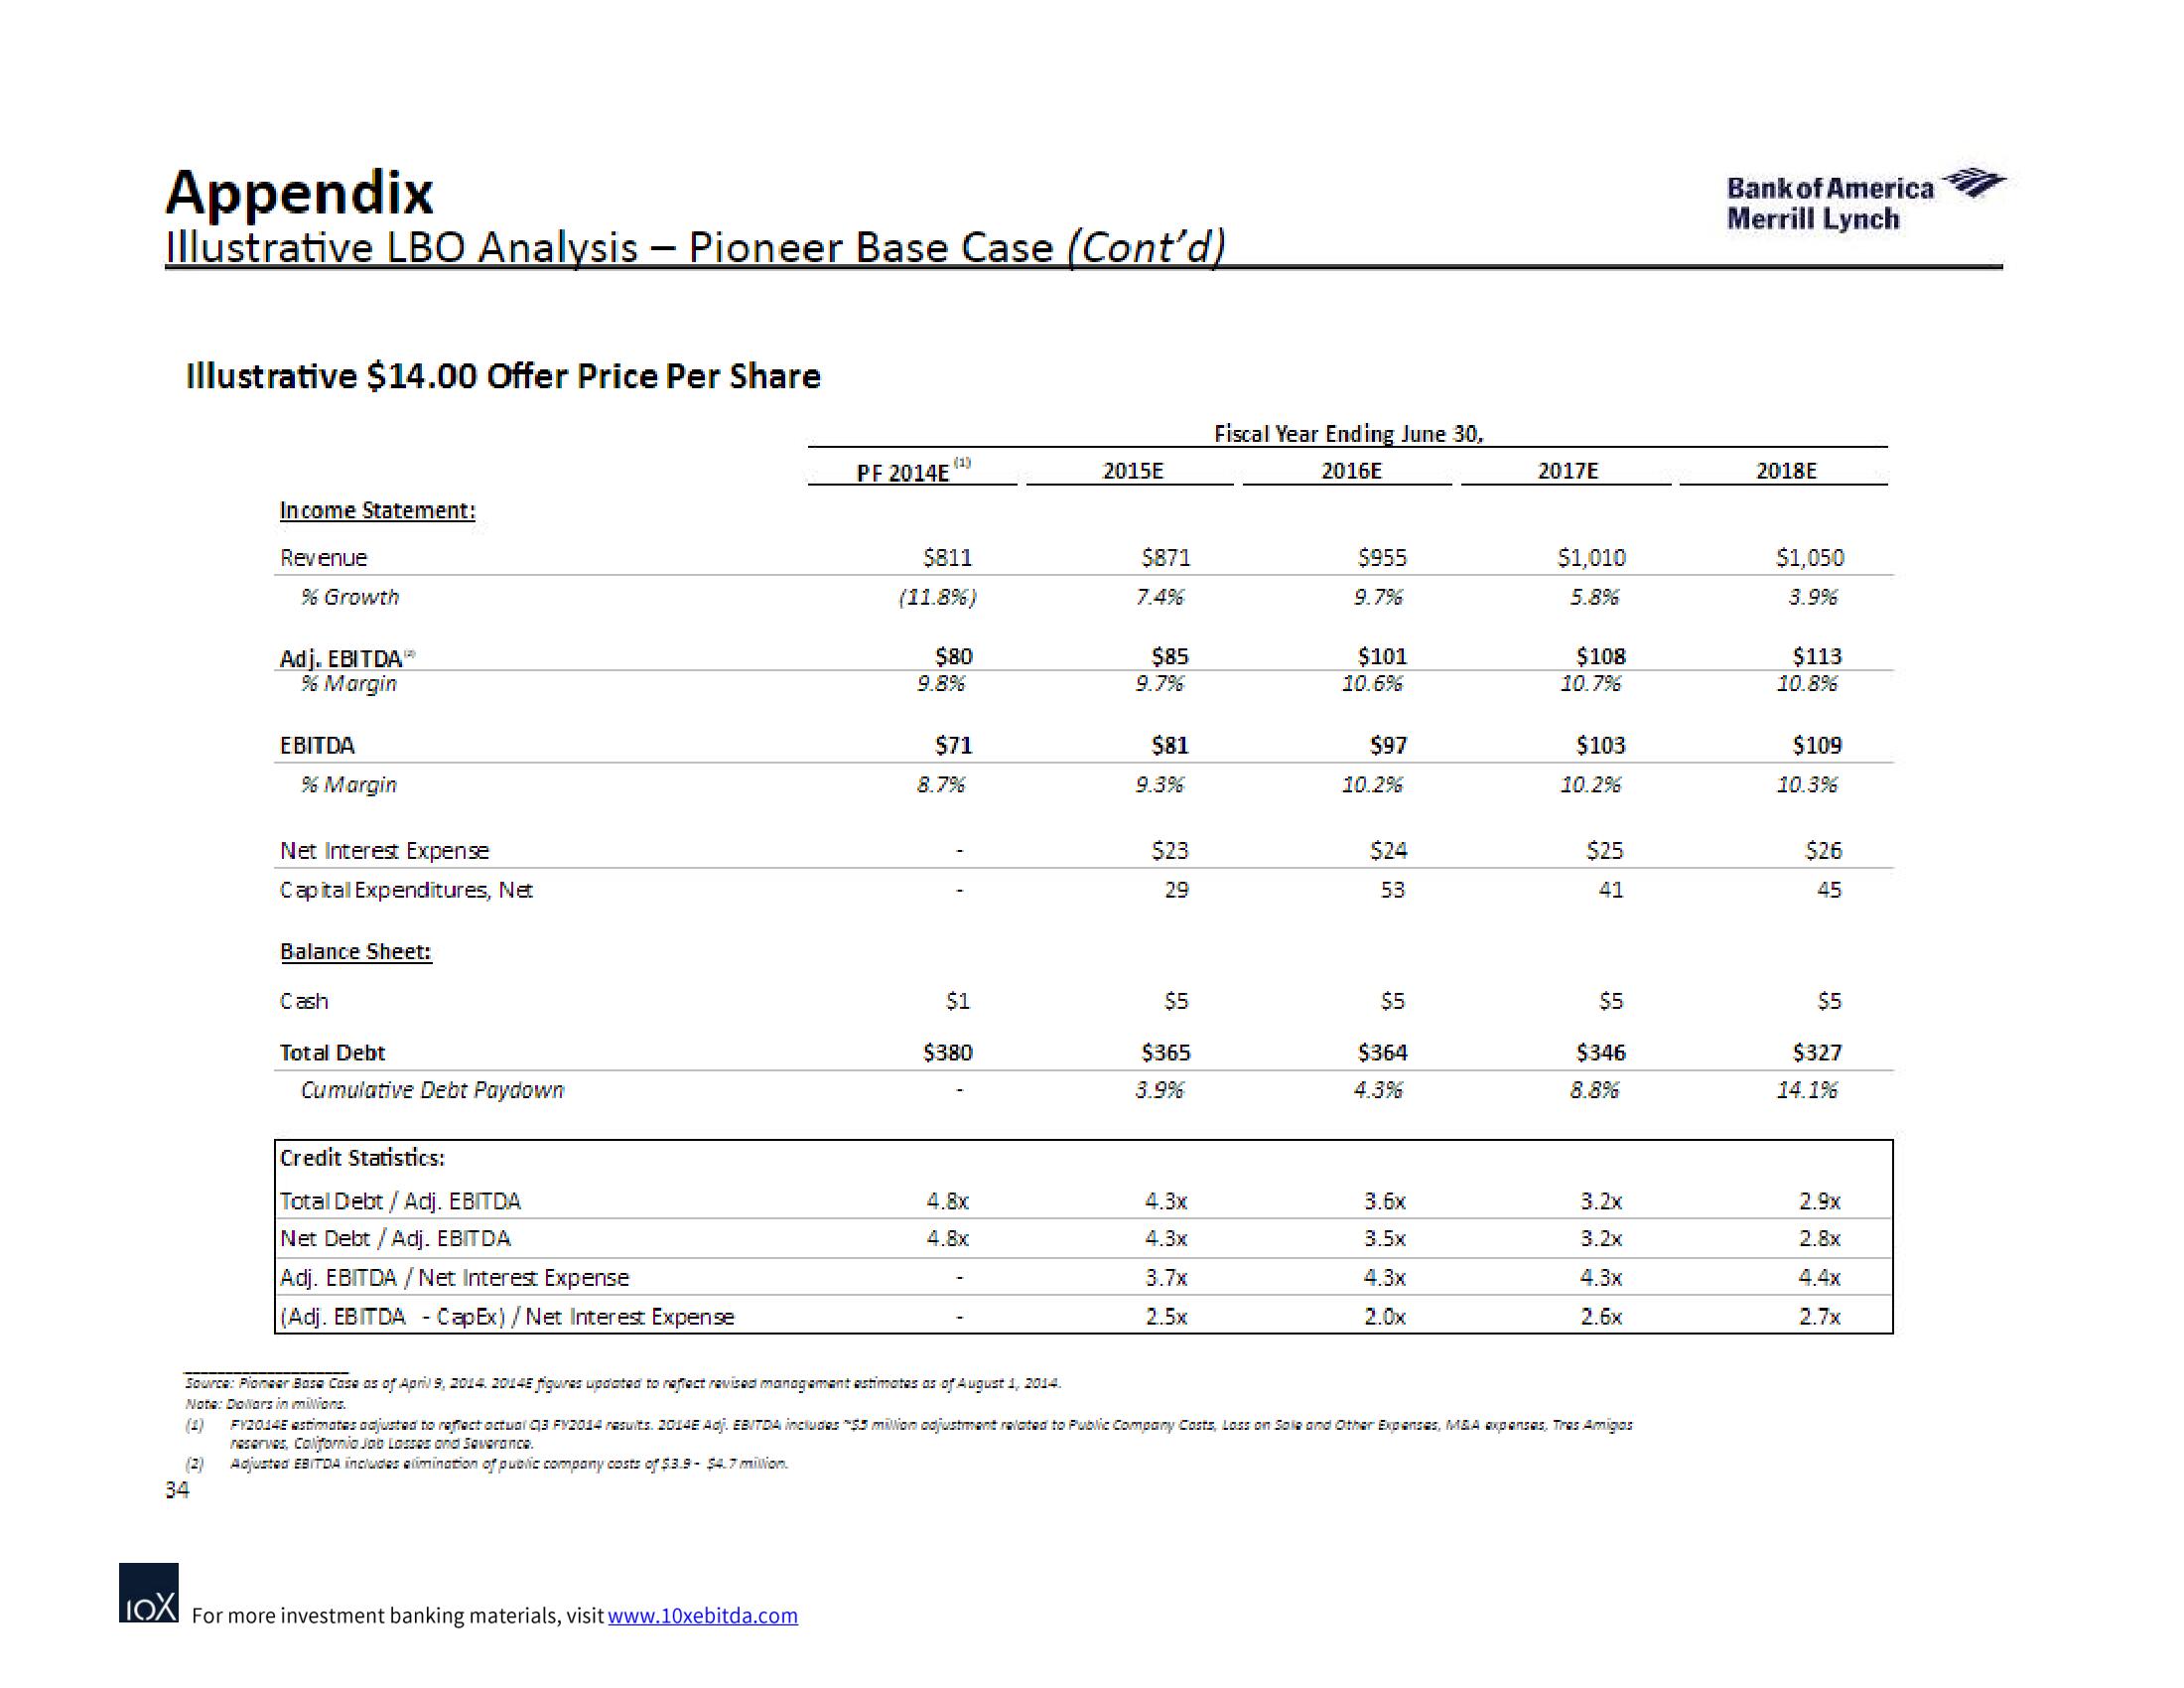
Illustrative LBO Analysis - Pioneer Base Case (Cont'd)
Illustrative $14.00 Offer Price Per Share
Income Statement:
Revenue
% Growth
Adj. EBITDAⓇ
% Margin
EBITDA
% Margin
Net Interest Expense
Capital Expenditures, Net
Balance Sheet:
Cash
Total Debt
Cumulative Debt Paydown
Credit Statistics:
Total Debt / Adj. EBITDA
Net Debt / Adj. EBITDA
Adj. EBITDA / Net Interest Expense
(Adj. EBITDA - CapEx)/ Net Interest Expense
PF 2014E
$811
(11.8%)
IOX For more investment banking materials, visit www.10xebitda.com
$80
9.8%
$71
8.7%
$1
$380
4.8x
4.8x
Source: Pioneer Base Casa as of April 9, 2014. 20145 figures updated to reflect revised management estimates as of August 1, 2014.
Note: Dollars in milions.
2015E
$871
$85
9.7%
$81
9.3%
$23
2.9
$5
$365
3.9%
4.3x
4.3x
3.7x
2.5x
Fiscal Year Ending June 30,
2016E
$955
9.7%
$101
10.6%
$97
10.2%
$24
53
$5
$364
4.3%
3.6x
3.5x
4.3x
2.0x
2017E
$1,010
5.8%
$108
10.7%
$103
10.2%
$25
41
$5
$346
8.8%
3.2x
3.2x
4.3x
2.6x
FY2014E estimates adjusted to reflect actual 3 FY2014 results. 2014E Adj. EBITDA includes $5 million adjustment related to Public Company Costs, Loss on Sale and Other Expenses, M&A expansas, Tras Amigas
reserves, California Job Lasses and Saverance.
(2) Adjusted EBITDA includes alimination of public company costs of $3.9- $4.7 million.
34
Bank of America
Merrill Lynch
2018E
$1,050
3.9%
$113
10.8%
$109
10.3%
$26
45
$5
$327
14.1%
2.9x
2.8x
4.4x
2.7xView entire presentation