Allego Investor Presentation Deck
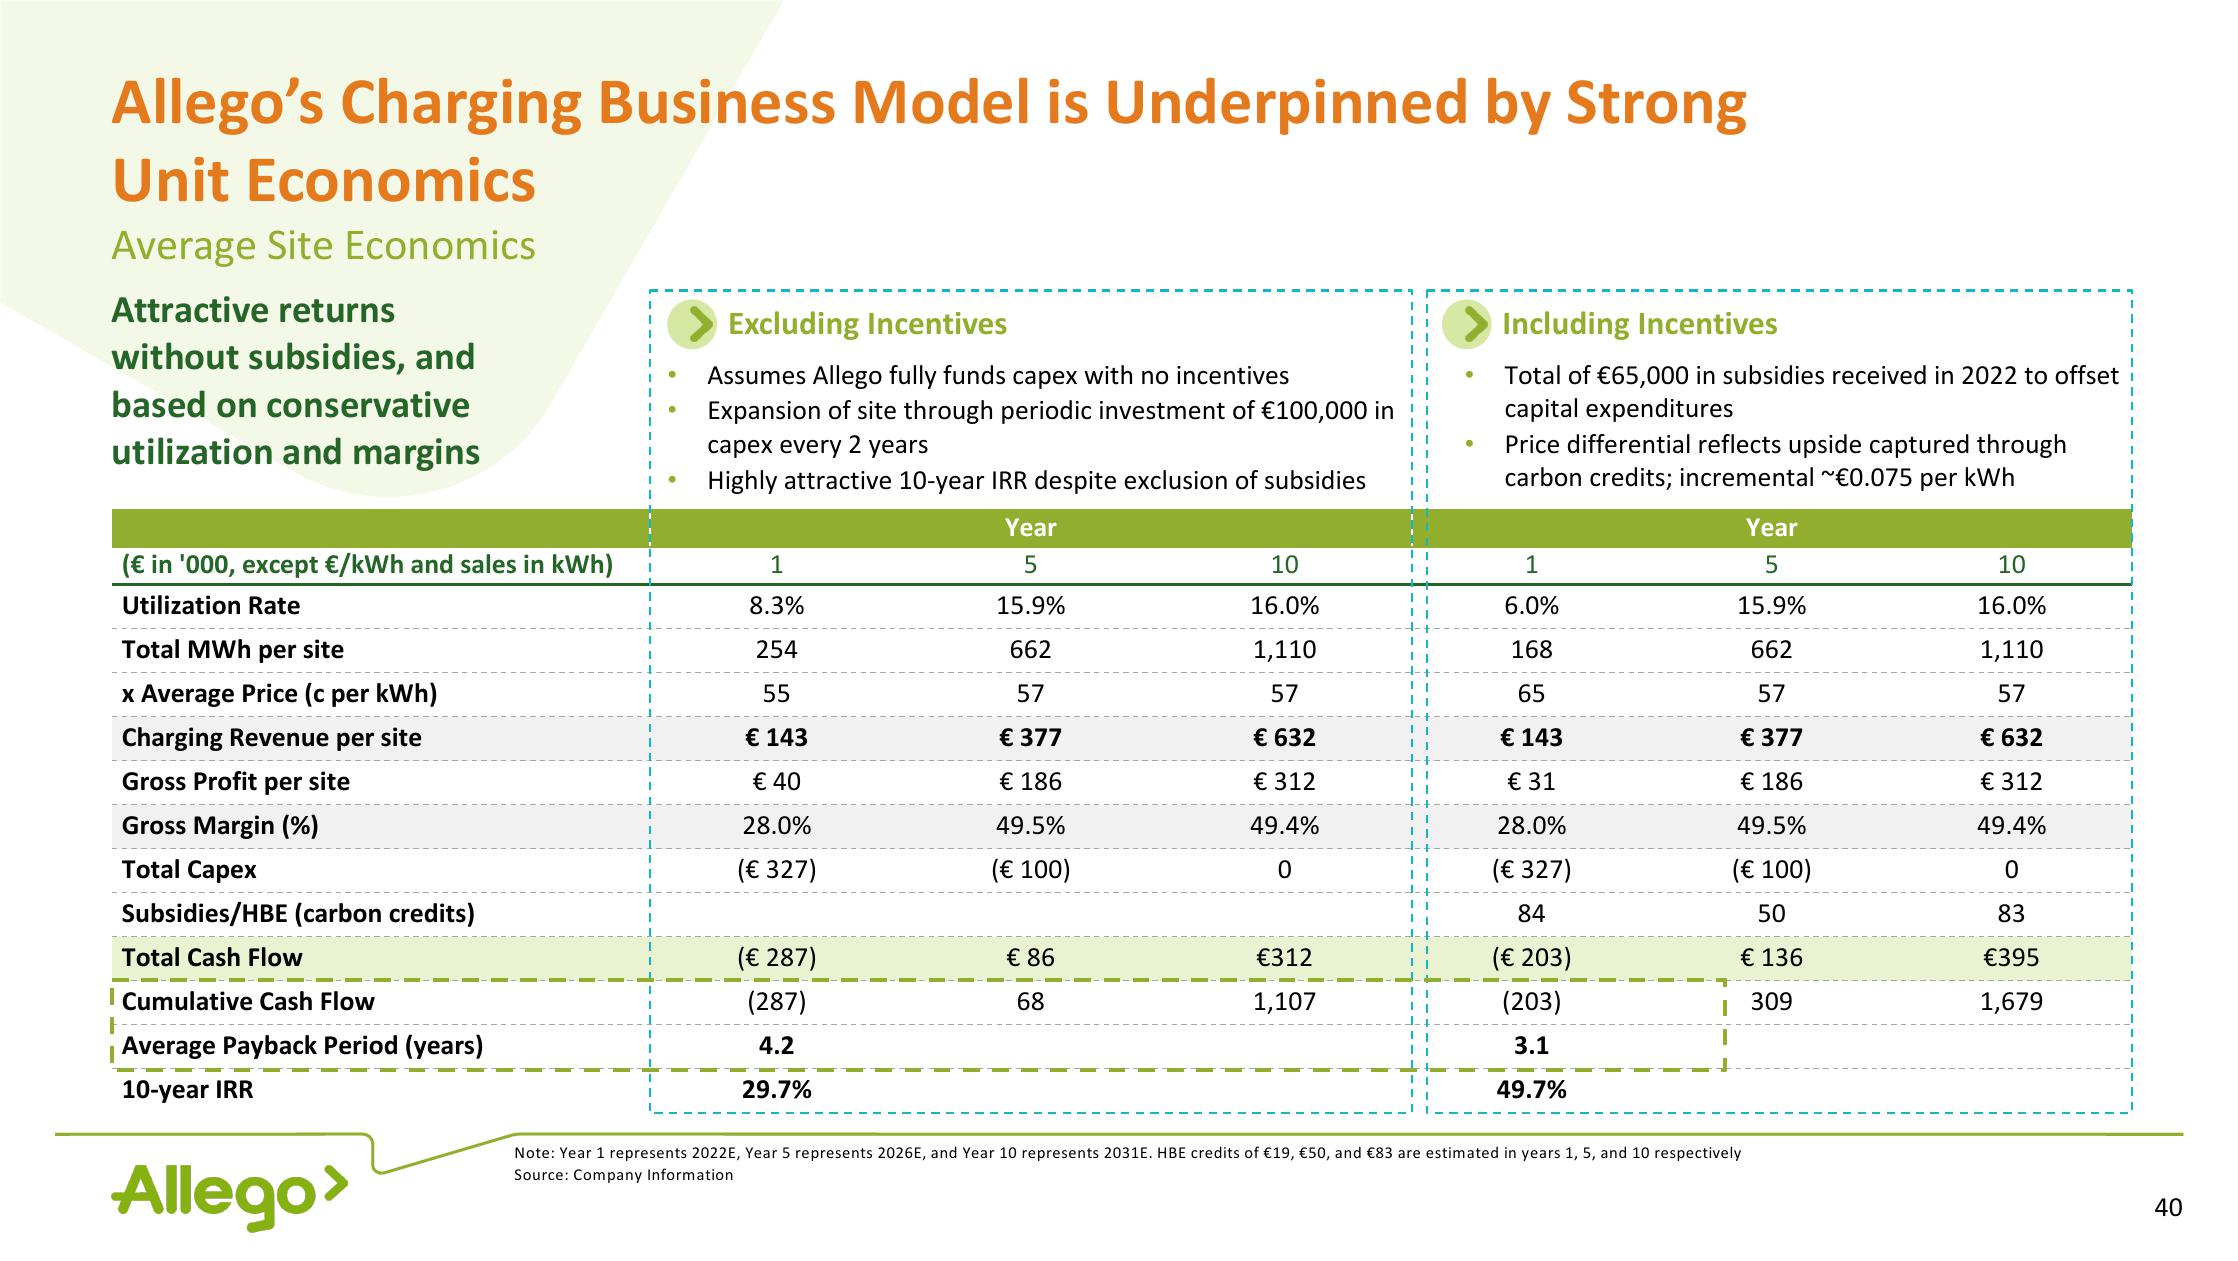
Allego's Charging Business Model is Underpinned by Strong
Unit Economics
Average Site Economics
Attractive returns
without subsidies, and
based on conservative
utilization and margins
(€ in '000, except €/kWh and sales in kWh)
Utilization Rate
Total MWh per site
x Average Price (c per kWh)
Charging Revenue per site
Gross Profit per site
Gross Margin (%)
Total Capex
Subsidies/HBE (carbon credits)
Total Cash Flow
Cumulative Cash Flow
Average Payback Period (years)
10-year IRR
Allego>
Excluding Incentives
Assumes Allego fully funds capex with no incentives
Expansion of site through periodic investment of €100,000 in
capex every 2 years
Highly attractive 10-year IRR despite exclusion of subsidies
1
8.3%
254
55
€ 143
€ 40
28.0%
(€ 327)
(€ 287)
(287)
4.2
29.7%
Year
5
15.9%
662
57
€ 377
€ 186
49.5%
(€ 100)
€ 86
68
10
16.0%
1,110
57
€ 632
€ 312
49.4%
0
€312
1,107
Including Incentives
Total of €65,000 in subsidies received in 2022 to offset
capital expenditures
Price differential reflects upside captured through
carbon credits; incremental ~€0.075 per kWh
1
6.0%
168
65
€ 143
€ 31
28.0%
(€ 327)
84
(€ 203)
(203)
3.1
49.7%
Year
5
15.9%
662
57
€ 377
€ 186
49.5%
(€ 100)
50
€ 136
I 309
Note: Year 1 represents 2022E, Year 5 represents 2026E, and Year 10 represents 2031E. HBE credits of €19, €50, and €83 are estimated in years 1, 5, and 10 respectively
Source: Company Information
10
16.0%
1,110
57
€ 632
€ 312
49.4%
0
83
€395
1,679
40View entire presentation