AMD Results Presentation Deck
20
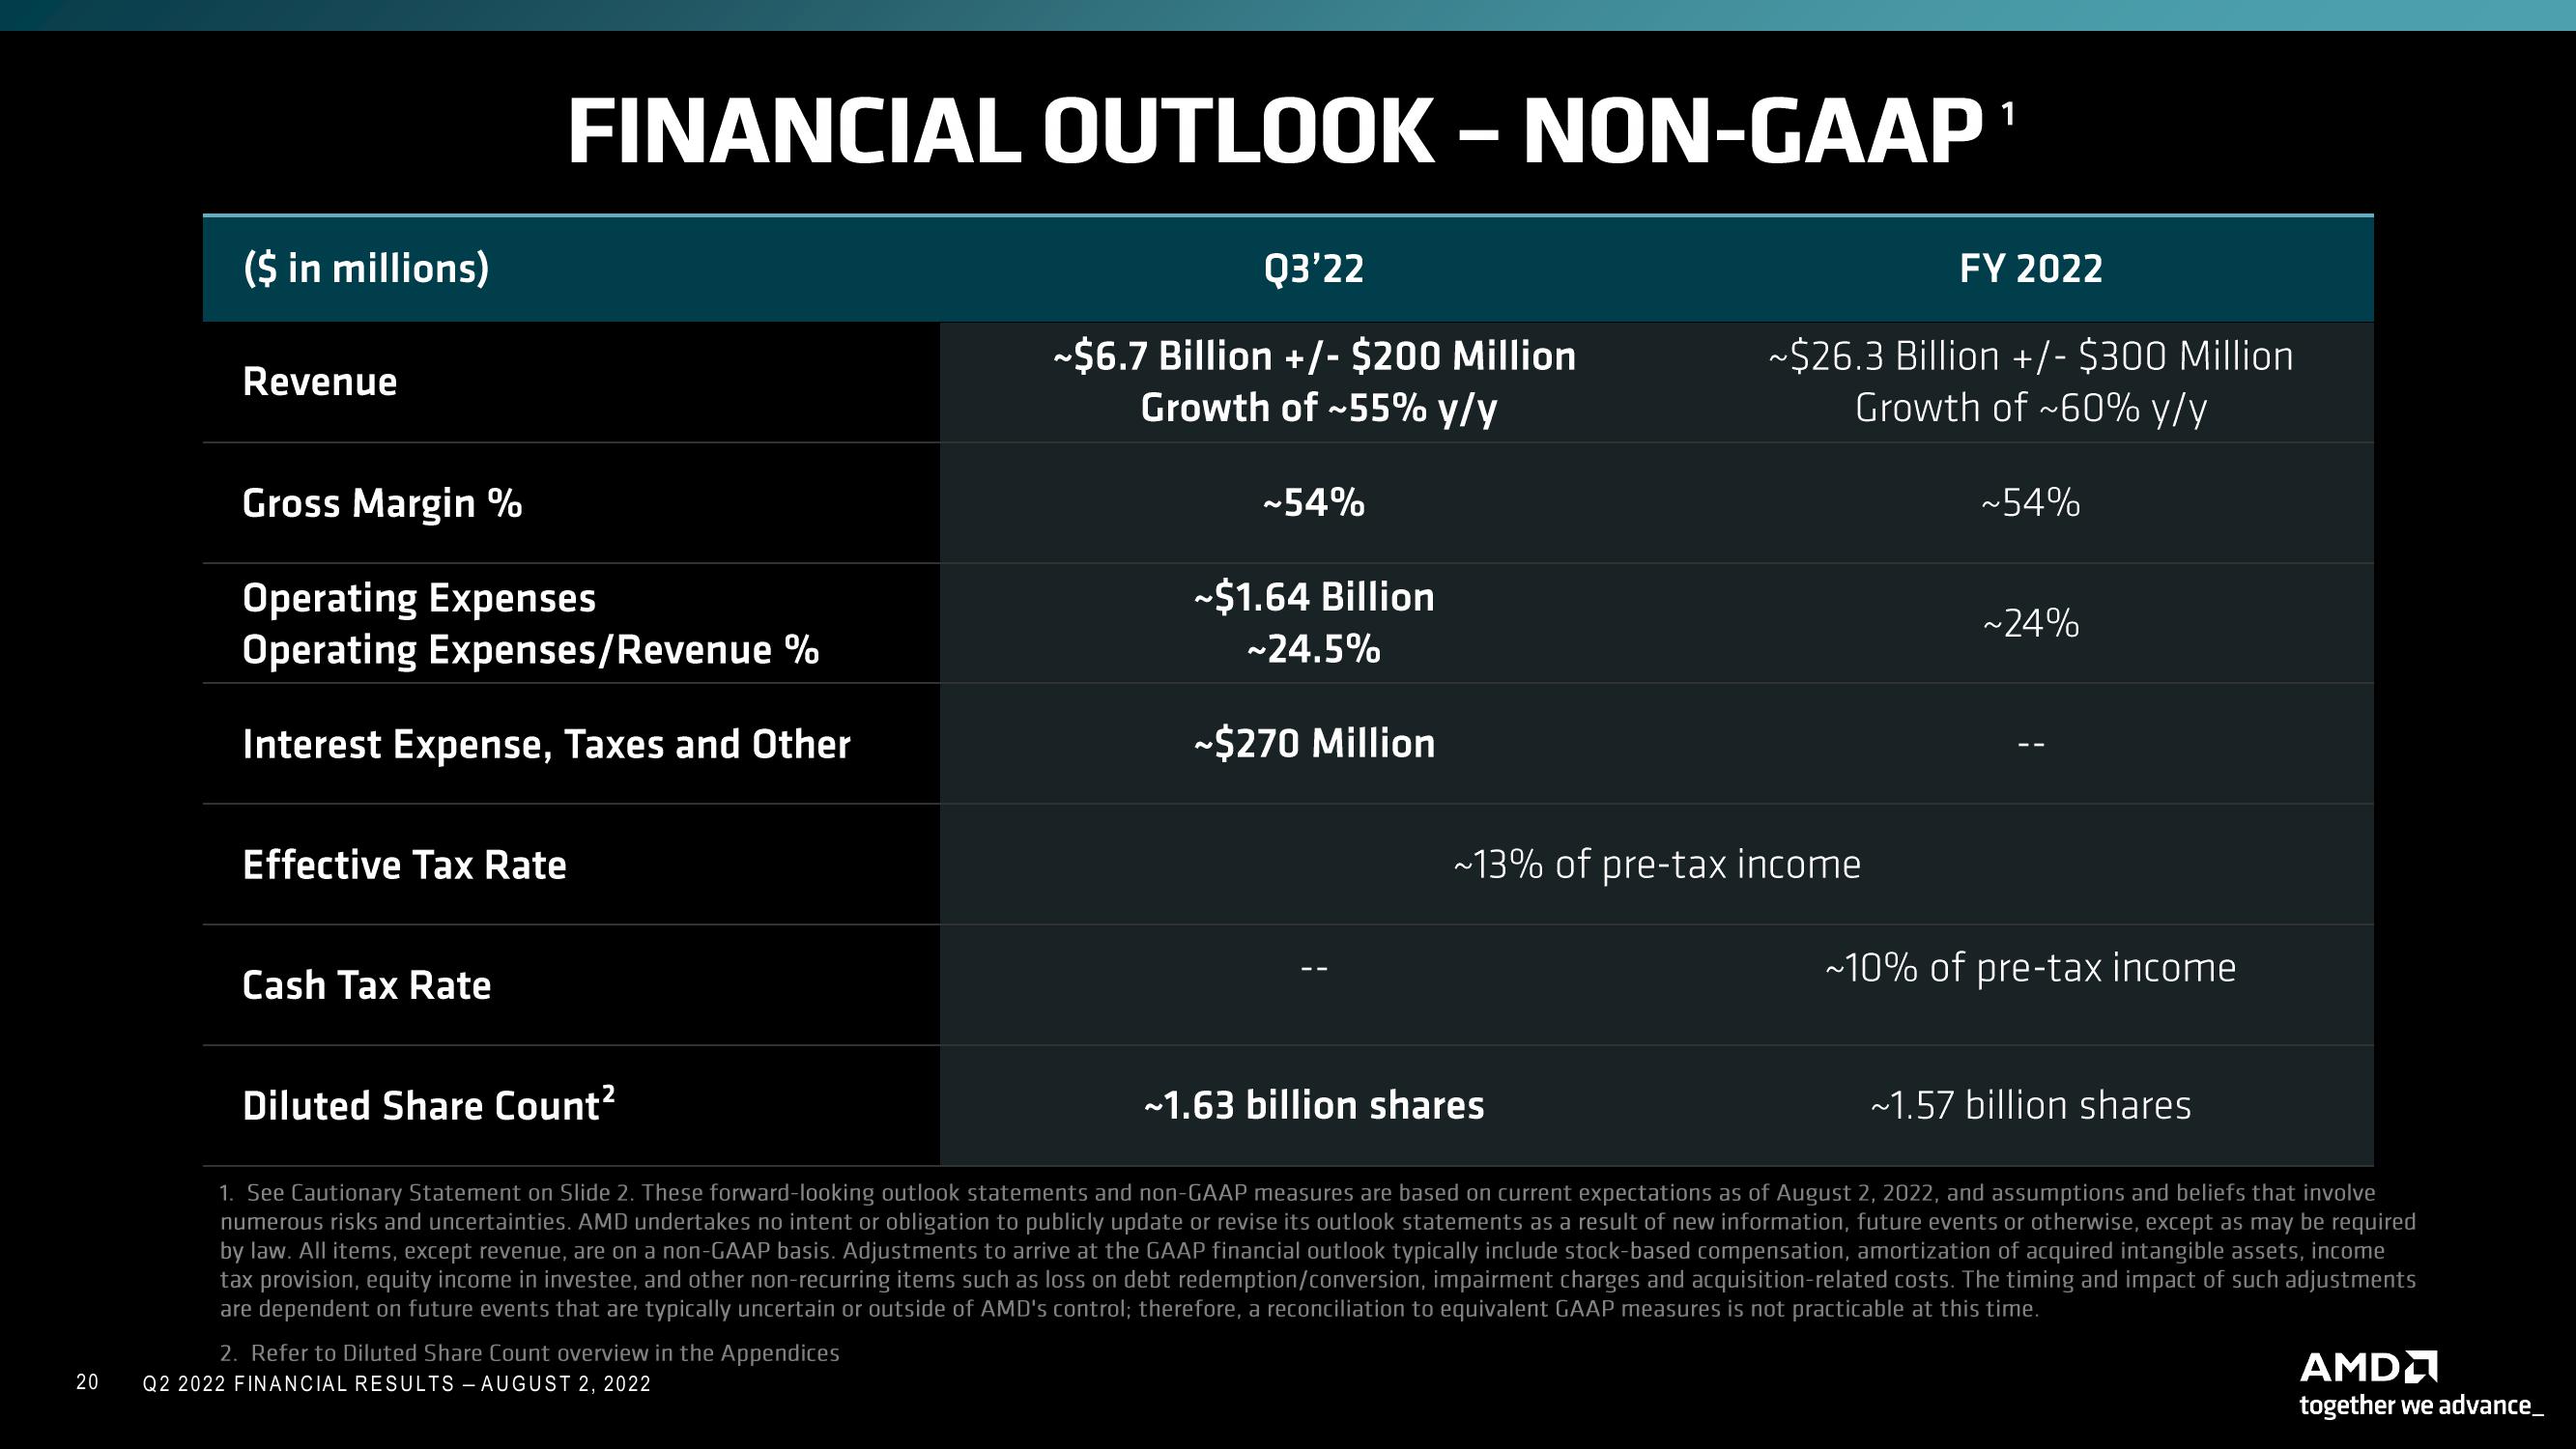
($ in millions)
Revenue
FINANCIAL OUTLOOK - NON-GAAP¹
Gross Margin %
Operating Expenses
Operating Expenses/Revenue %
Interest Expense, Taxes and Other
Effective Tax Rate
Cash Tax Rate
2. Refer to Diluted Share Count overview in the Appendices
Q3'22
~$6.7 Billion +/- $200 Million
Growth of ~55% y/y
Q2 2022 FINANCIAL RESULTS - AUGUST 2, 2022
~54%
~$1.64 Billion
~24.5%
~$270 Million
FY 2022
~$26.3 Billion +/- $300 Million
Growth of ~60% y/y
~13% of pre-tax income
~54%
~24%
Diluted Share Count²
~1.63 billion shares
1. See Cautionary Statement on Slide 2. These forward-looking outlook statements and non-GAAP measures are based on current expectations as of August 2, 2022, and assumptions and beliefs that involve
numerous risks and uncertainties. AMD undertakes no intent or obligation to publicly update or revise its outlook statements as a result of new information, future events or otherwise, except as may be required
by law. All items, except revenue, are on a non-GAAP basis. Adjustments to arrive at the GAAP financial outlook typically include stock-based compensation, amortization of acquired intangible assets, income
tax provision, equity income in investee, and other non-recurring items such as loss on debt redemption/conversion, impairment charges and acquisition-related costs. The timing and impact of such adjustments
are dependent on future events that are typically uncertain or outside of AMD's control; therefore, a reconciliation to equivalent GAAP measures is not practicable at this time.
~10% of pre-tax income
~1.57 billion shares
AMD
together we advance_View entire presentation