Credit Suisse Investment Banking Pitch Book
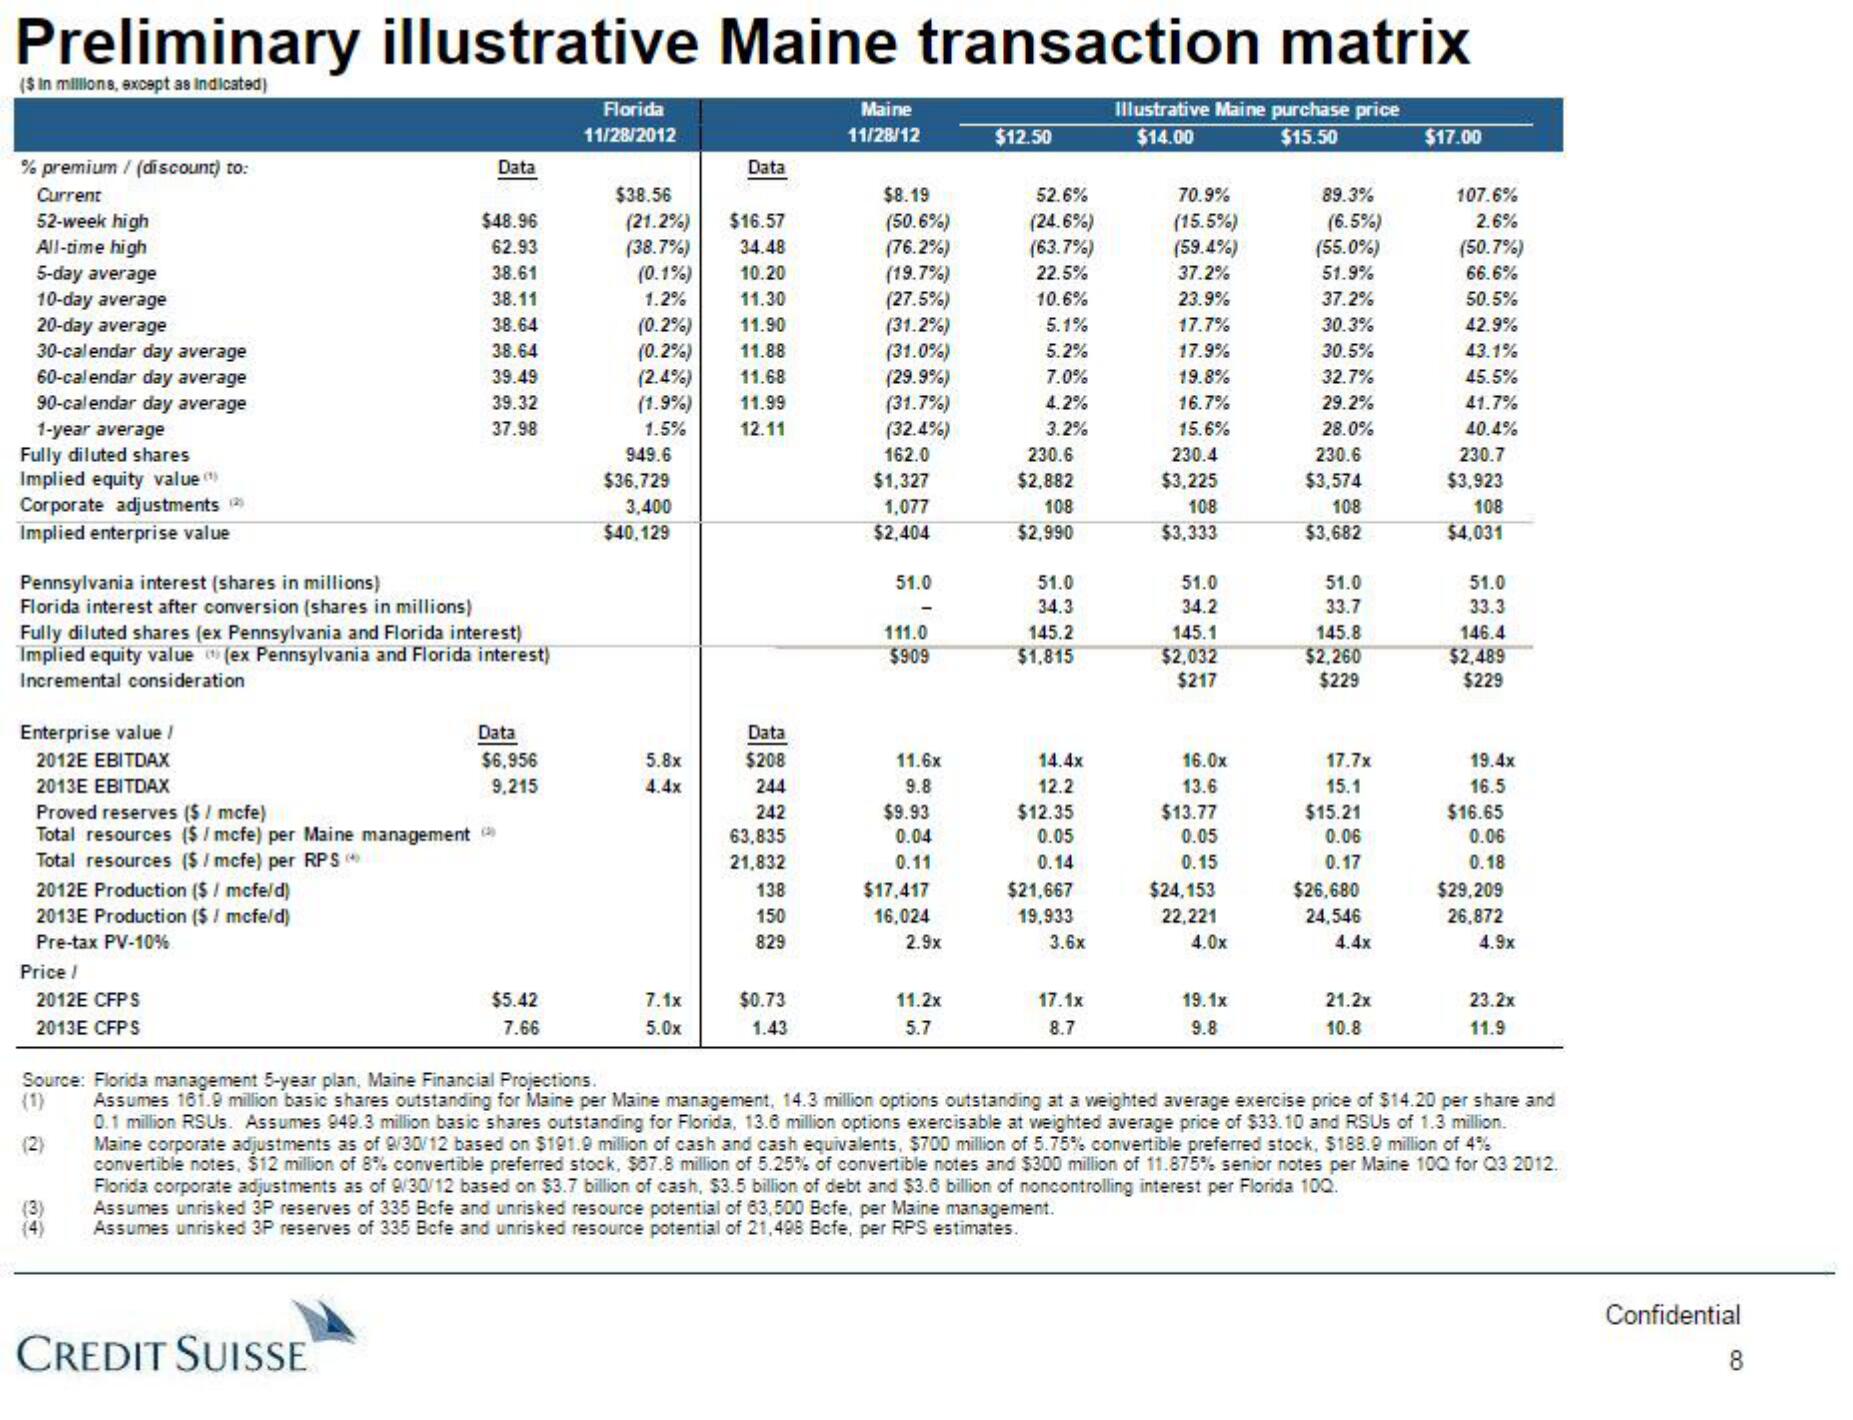
Preliminary illustrative Maine transaction matrix
($ in millions, except as indicated)
% premium / (discount) to:
Current
52-week high
All-time high
5-day average
10-day average
20-day average
30-calendar day average
60-calendar day average
90-calendar day average
1-year average
Fully diluted shares
Implied equity value (¹)
Corporate adjustments (2)
Implied enterprise value
Pennsylvania interest (shares in millions)
Florida interest after conversion (shares in millions)
Enterprise value /
2012E EBITDAX
Fully diluted shares (ex Pennsylvania and Florida interest)
Implied equity value (ex Pennsylvania and Florida interest)
Incremental consideration
2012E Production ($/ mcfe/d)
2013E Production ($ / mcfe/d)
Pre-tax PV-10%
2013E EBITDAX
Proved reserves ($ / mcfe)
Total resources ($/ mcfe) per Maine management (
Total resources ($/mcfe) per RPS →
Price /
2012E CFPS
2013E CFPS
Data
$48.96
62.93
38.61
38.11
38.64
38.64
39.49
39.32
37.98
(3)
CREDIT SUISSE
Data
$6,956
9,215
$5.42
7.66
Florida
11/28/2012
$38.56
(21.2%) $16.57
(38.7%)
34.48
10.20
(0.1%)
1.2%
11.30
(0.2%)
11.90
(0.2%)
11.88
(2.4%) 11.68
(1.9%)
11.99
12.11
1.5%
949.6
$36,729
3,400
$40,129
5.8x
4.4x
Data
7.1x
5.0x
Data
$208
244
242
63,835
21,832
138
150
829
$0.73
1.43
Maine
11/28/12
$8.19
(50.6%)
(76.2%)
(19.7%)
(27.5%)
(31.2%)
(31.0%)
(29.9%)
(31.7%)
(32.4%)
162.0
$1,327
1,077
$2,404
51.0
111.0
$909
11.6x
9.8
$9.93
0.04
0.11
$17,417
16,024
2.9x
11.2x
5.7
$12.50
52.6%
(24.6%)
(63.7%)
22.5%
10.6%
5.1%
5.2%
7.0%
4.2%
3.2%
230.6
$2,882
108
$2,990
51.0
34.3
145.2
$1,815
14.4x
12.2
$12.35
0.05
0.14
$21,667
19,933
3.6x
17.1x
8.7
Illustrative Maine purchase price
$14.00
$15.50
70.9%
(15.5%)
(59.4%)
37.2%
23.9%
17.7%
17.9%
19.8%
16.7%
15.6%
230.4
$3,225
108
$3,333
51.0
34.2
145.1
$2,032
$217
16.0x
13.6
$13.77
0.05
0.15
$24,153
22,221
4.0x
19.1x
9.8
89.3%
(6.5%)
(55.0%)
51.9%
37.2%
30.3%
30.5%
32.7%
29.2%
28.0%
230.6
$3,574
108
$3,682
51.0
33.7
145.8
$2,260
$229
17.7x
15.1
$15.21
0.06
0.17
$26,680
24,546
4.4x
21.2x
10.8
$17.00
107.6%
2.6%
(50.7%)
66.6%
50.5%
42.9%
43.1%
45.5%
41.7%
40.4%
230.7
$3,923
108
$4,031
51.0
33.3
146.4
$2,489
$229
19.4x
16.5
$16.65
0.06
0.18
$29,209
26,872
4.9x
(2)
Source: Florida management 5-year plan, Maine Financial Projections.
(1) Assumes 161.9 million basic shares outstanding for Maine per Maine management, 14.3 million options outstanding at a weighted average exercise price of $14.20 per share and
0.1 million RSUS. Assumes 949.3 million basic shares outstanding for Florida, 13.6 million options exercisable at weighted average price of $33.10 and RSUS of 1.3 million.
Maine corporate adjustments as of 9/30/12 based on $191.9 million of cash and cash equivalents, $700 million of 5.75% convertible preferred stock, $188.9 million of 4%
convertible notes, $12 million of 8% convertible preferred stock, $87.8 million of 5.25% of convertible notes and $300 million of 11.875% senior notes per Maine 100 for Q3 2012.
Florida corporate adjustments as of 9/30/12 based on $3.7 billion of cash, $3.5 billion of debt and $3.6 billion of noncontrolling interest per Florida 100.
Assumes unrisked 3P reserves of 335 Befe and unrisked resource potential of 63,500 Bofe, per Maine management.
Assumes unrisked 3P reserves of 335 Bcfe and unrisked resource potential of 21,498 Bcfe, per RPS estimates.
23.2x
11.9
Confidential
8View entire presentation