Carlyle Investor Day Presentation Deck
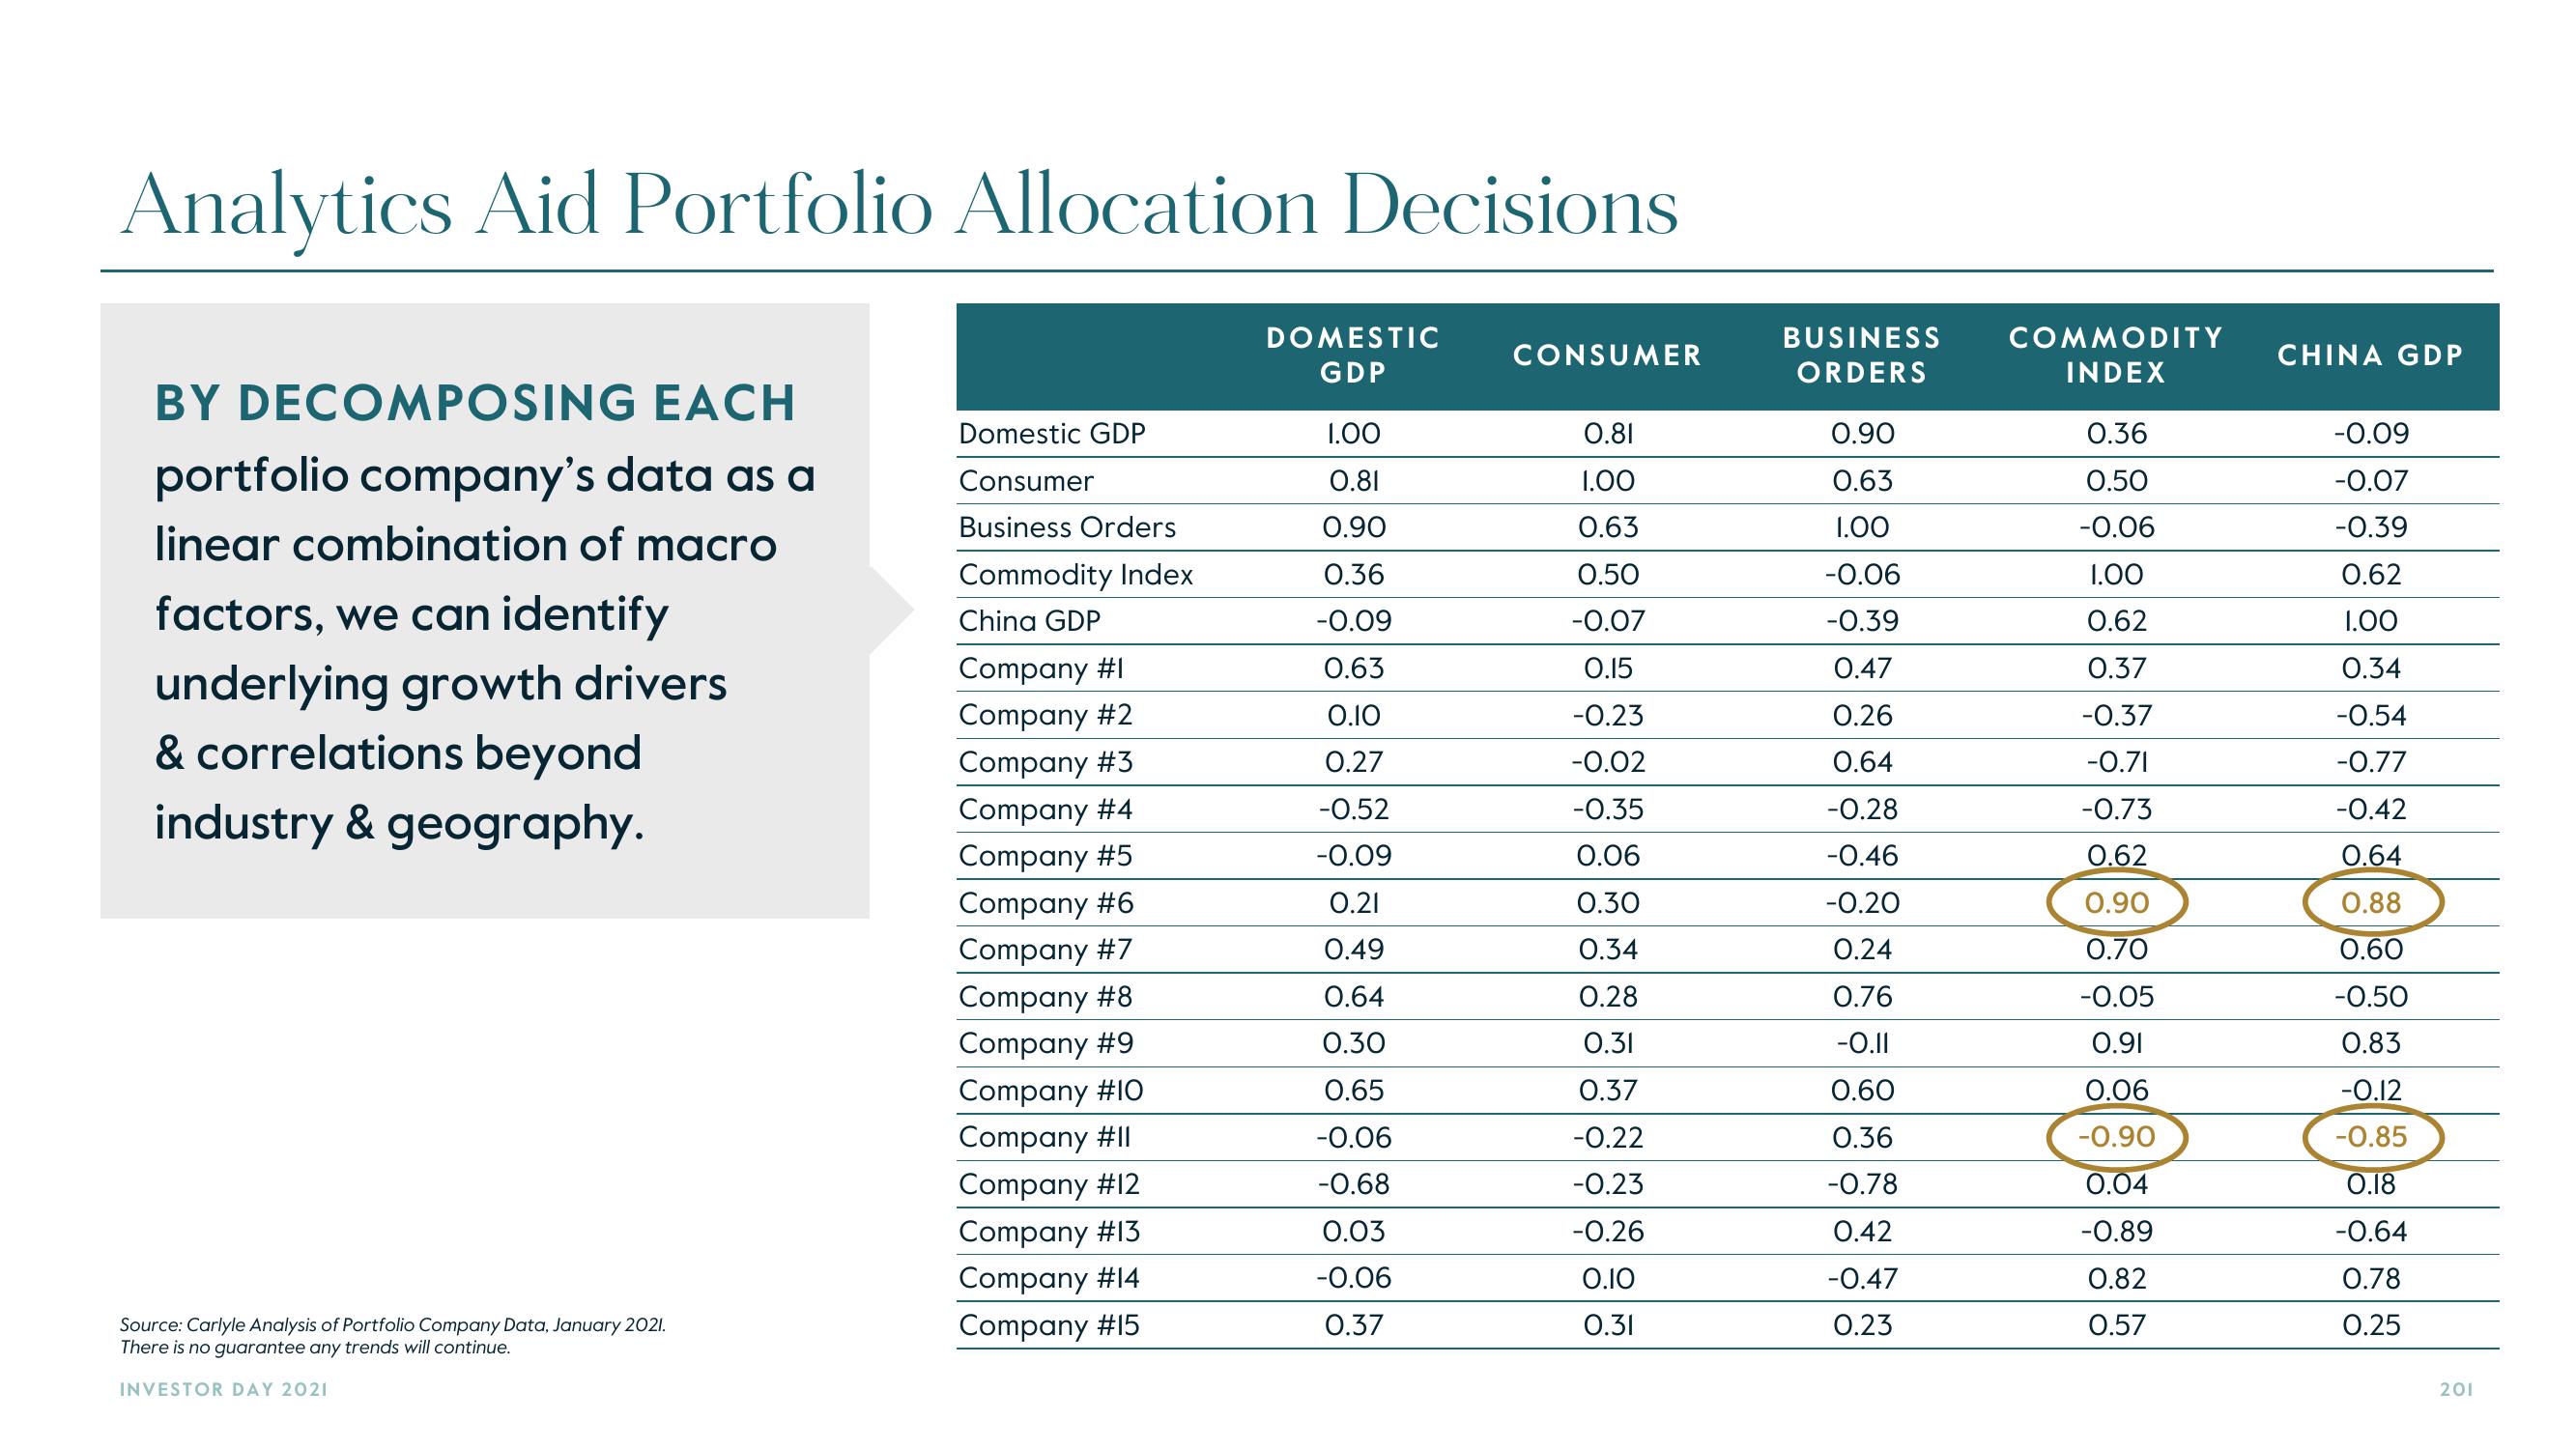
Analytics Aid Portfolio Allocation Decisions
BY DECOMPOSING EACH
portfolio company's data as a
linear combination of macro
factors, we can identify
underlying growth drivers
& correlations beyond
industry & geography.
Source: Carlyle Analysis of Portfolio Company Data, January 2021.
There is no guarantee any trends will continue.
INVESTOR DAY 2021
Domestic GDP
Consumer
Business Orders
Commodity Index
China GDP
Company #1
Company #2
Company #3
Company #4
Company #5
Company #6
Company #7
Company #8
Company #9
Company #10
Company #11
Company #12
Company #13
Company #14
Company #15
DOMESTIC
GDP
1.00
0.81
0.90
0.36
-0.09
0.63
0.10
0.27
-0.52
-0.09
0.21
0.49
0.64
0.30
0.65
-0.06
-0.68
0.03
-0.06
0.37
CONSUMER
0.81
1.00
0.63
0.50
-0.07
0.15
-0.23
-0.02
-0.35
0.06
0.30
0.34
0.28
0.31
0.37
-0.22
-0.23
-0.26
0.10
0.31
BUSINESS
ORDERS
0.90
0.63
1.00
-0.06
-0.39
0.47
0.26
0.64
-0.28
-0.46
-0.20
0.24
0.76
-0.11
0.60
0.36
-0.78
0.42
-0.47
0.23
COMMODITY
INDEX
0.36
0.50
-0.06
1.00
0.62
0.37
-0.37
-0.71
-0.73
0.62
0.90
0.70
-0.05
0.91
0.06
-0.90
0.04
-0.89
0.82
0.57
CHINA GDP
-0.09
-0.07
-0.39
0.62
1.00
0.34
-0.54
-0.77
-0.42
0.64
0.88
0.60
-0.50
0.83
-0.12
-0.85
0.18
-0.64
0.78
0.25
201View entire presentation