Sportradar IPO Presentation Deck
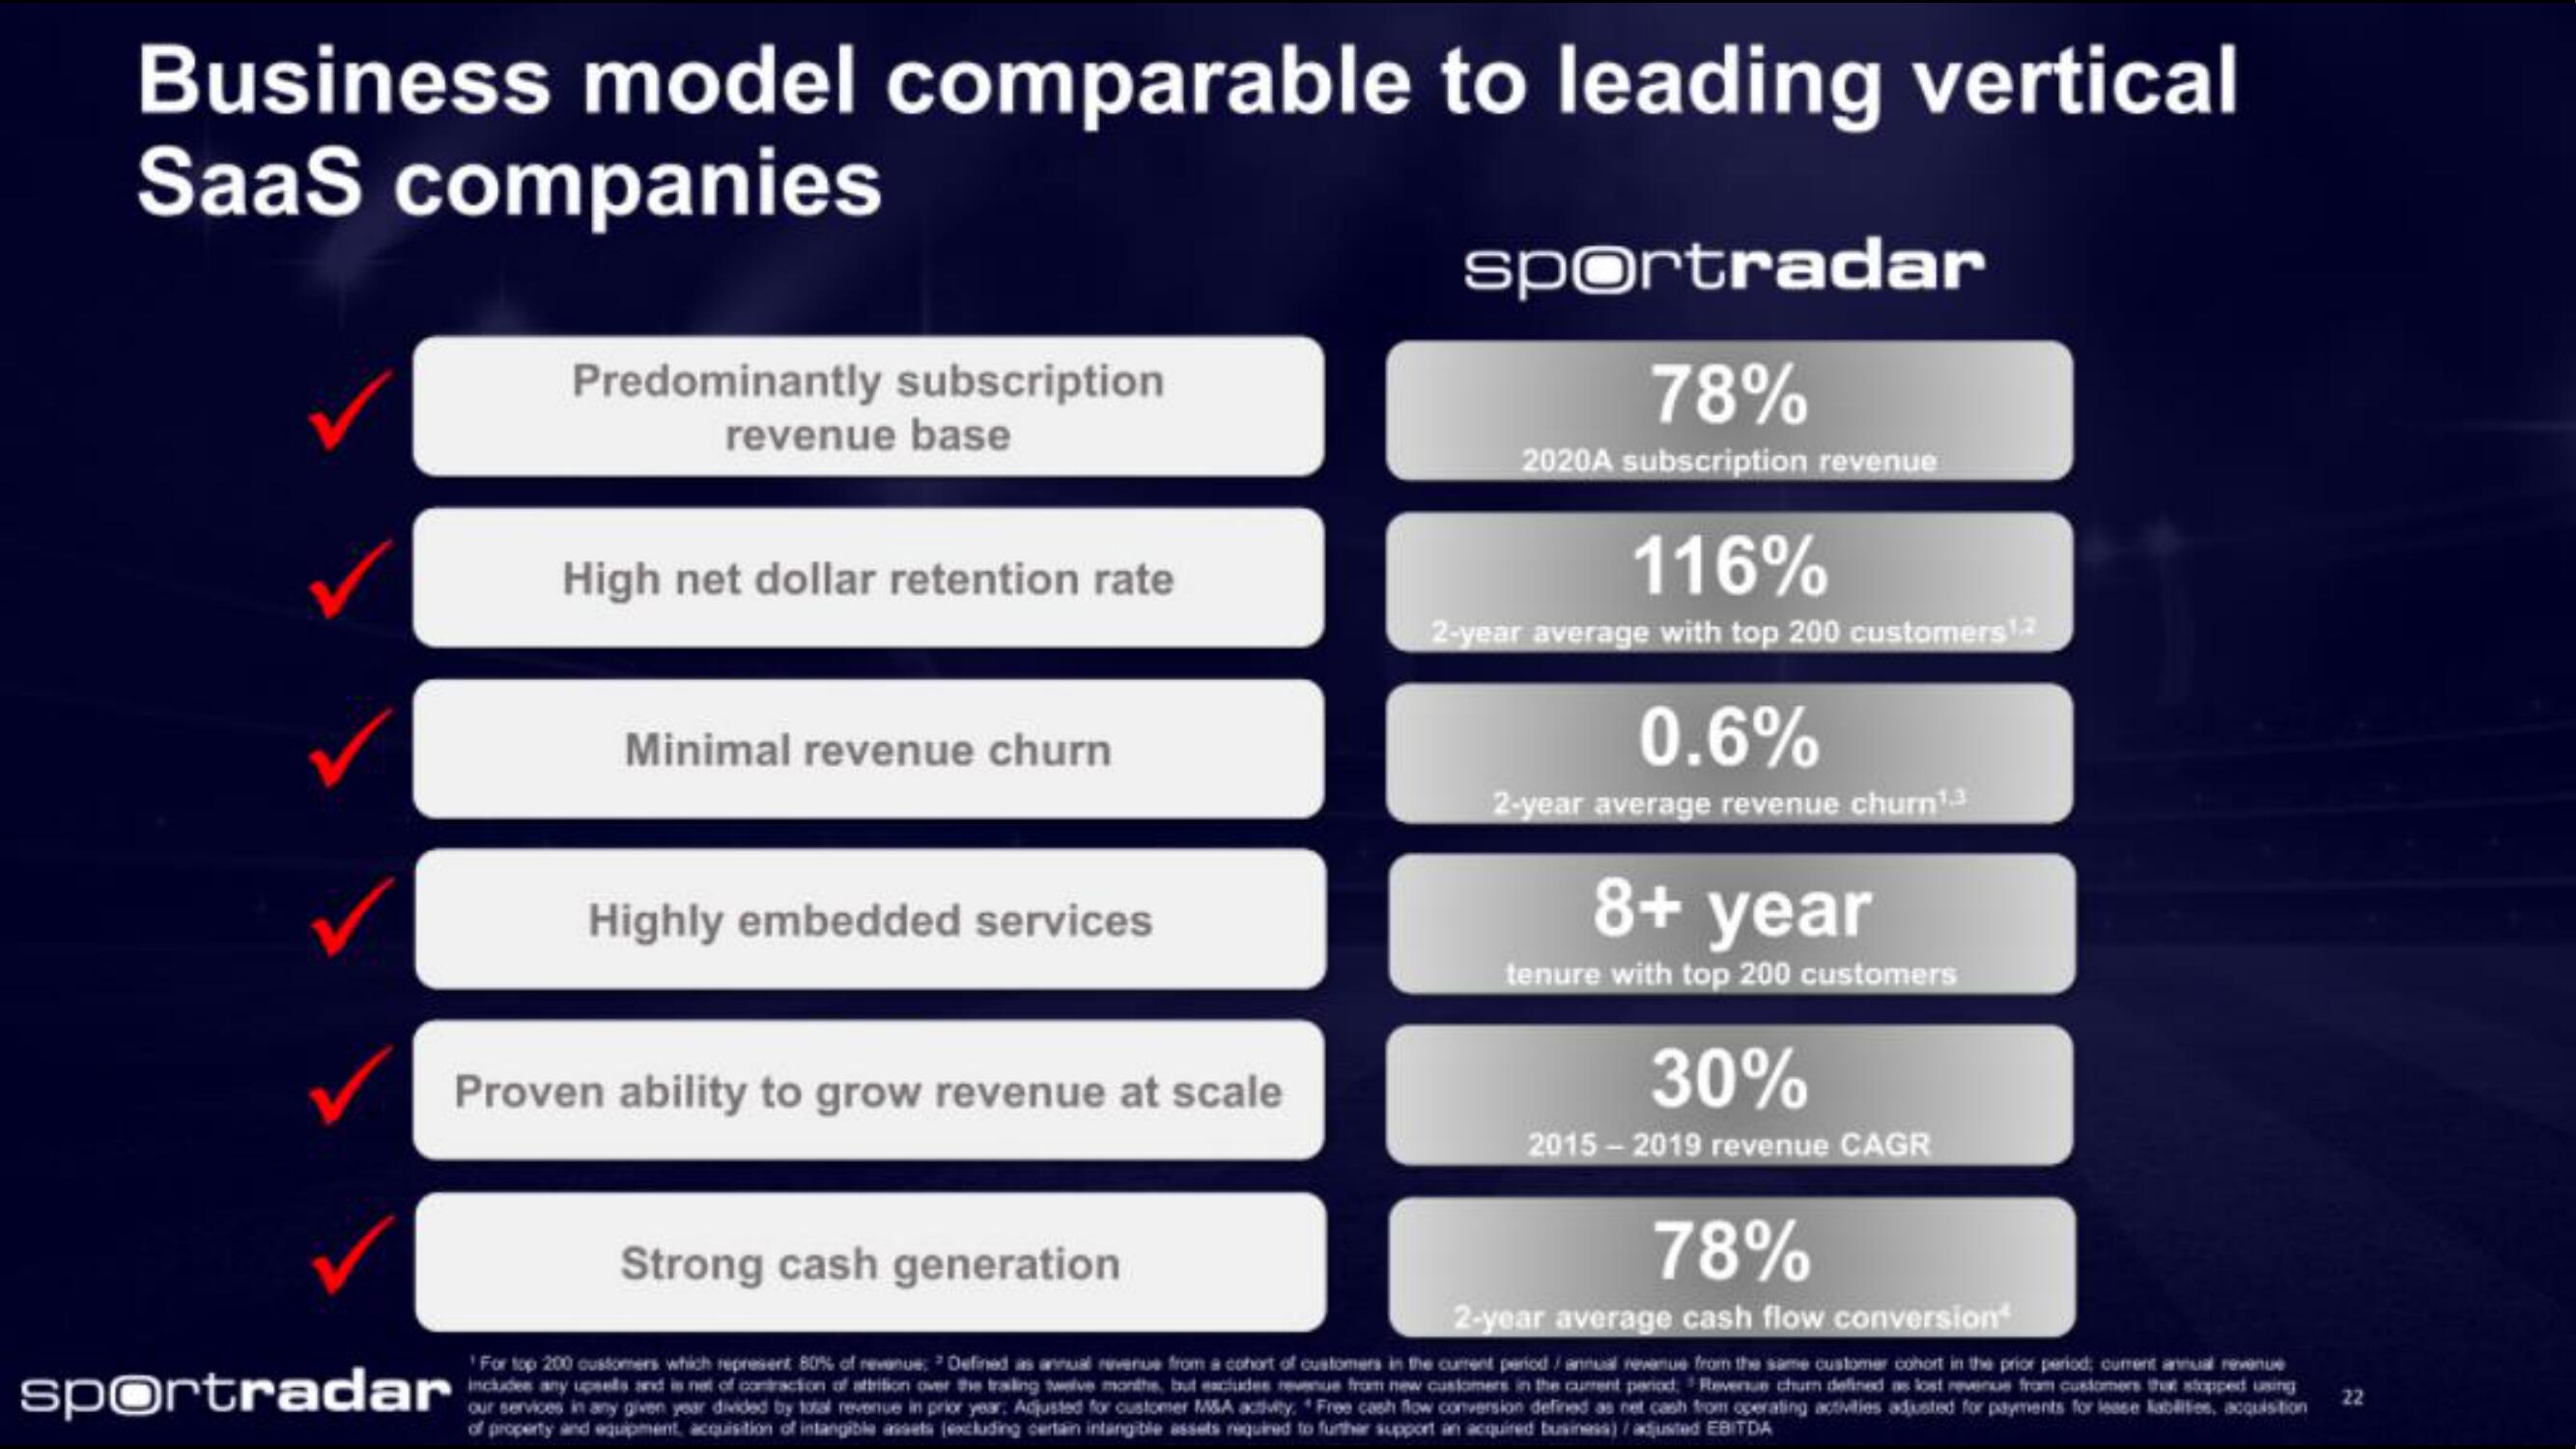
Business model comparable
SaaS companies
Predominantly subscription
revenue base
High net dollar retention rate
Minimal revenue churn
Highly embedded services
Proven ability to grow revenue at scale
to leading vertical
sportradar
78%
2020A subscription revenue
sportradarietes any costs and an et of contaction of station her the braing bathe is be
116%
2-year average with top 200 customers 1.2
0.6%
2-year average revenue churn¹.3
8+ year
tenure with top 200 customers
30%
2015-2019 revenue CAGR
Strong cash generation
78%
2-year average cash flow conversion
For top 200 customers which represent 80% of revenue: Defined as annual revenue from a cohort of customers in the current period / annual revenue from the same customer cohort in the prior period, current annual revenue
t excludes revenue from new customers in the current period. Revenue chum defined as lost revenue from customers that stopped using
our services in any given year divided by total revenue in prior year: Adjusted for customer M&A activity. Free cash flow conversion defined as net cash from operating activities adjusted for payments for lease abilities, acquisition
of property and equipment, acquisition of intangible assets (excluding certain intangible assets required to further support an acquired business) / adjusted EBITDA
22View entire presentation