Allwyn Results Presentation Deck
Q3 2023 financial highlights
A quarter of solid financial performance notwithstanding top line headwinds
●
●
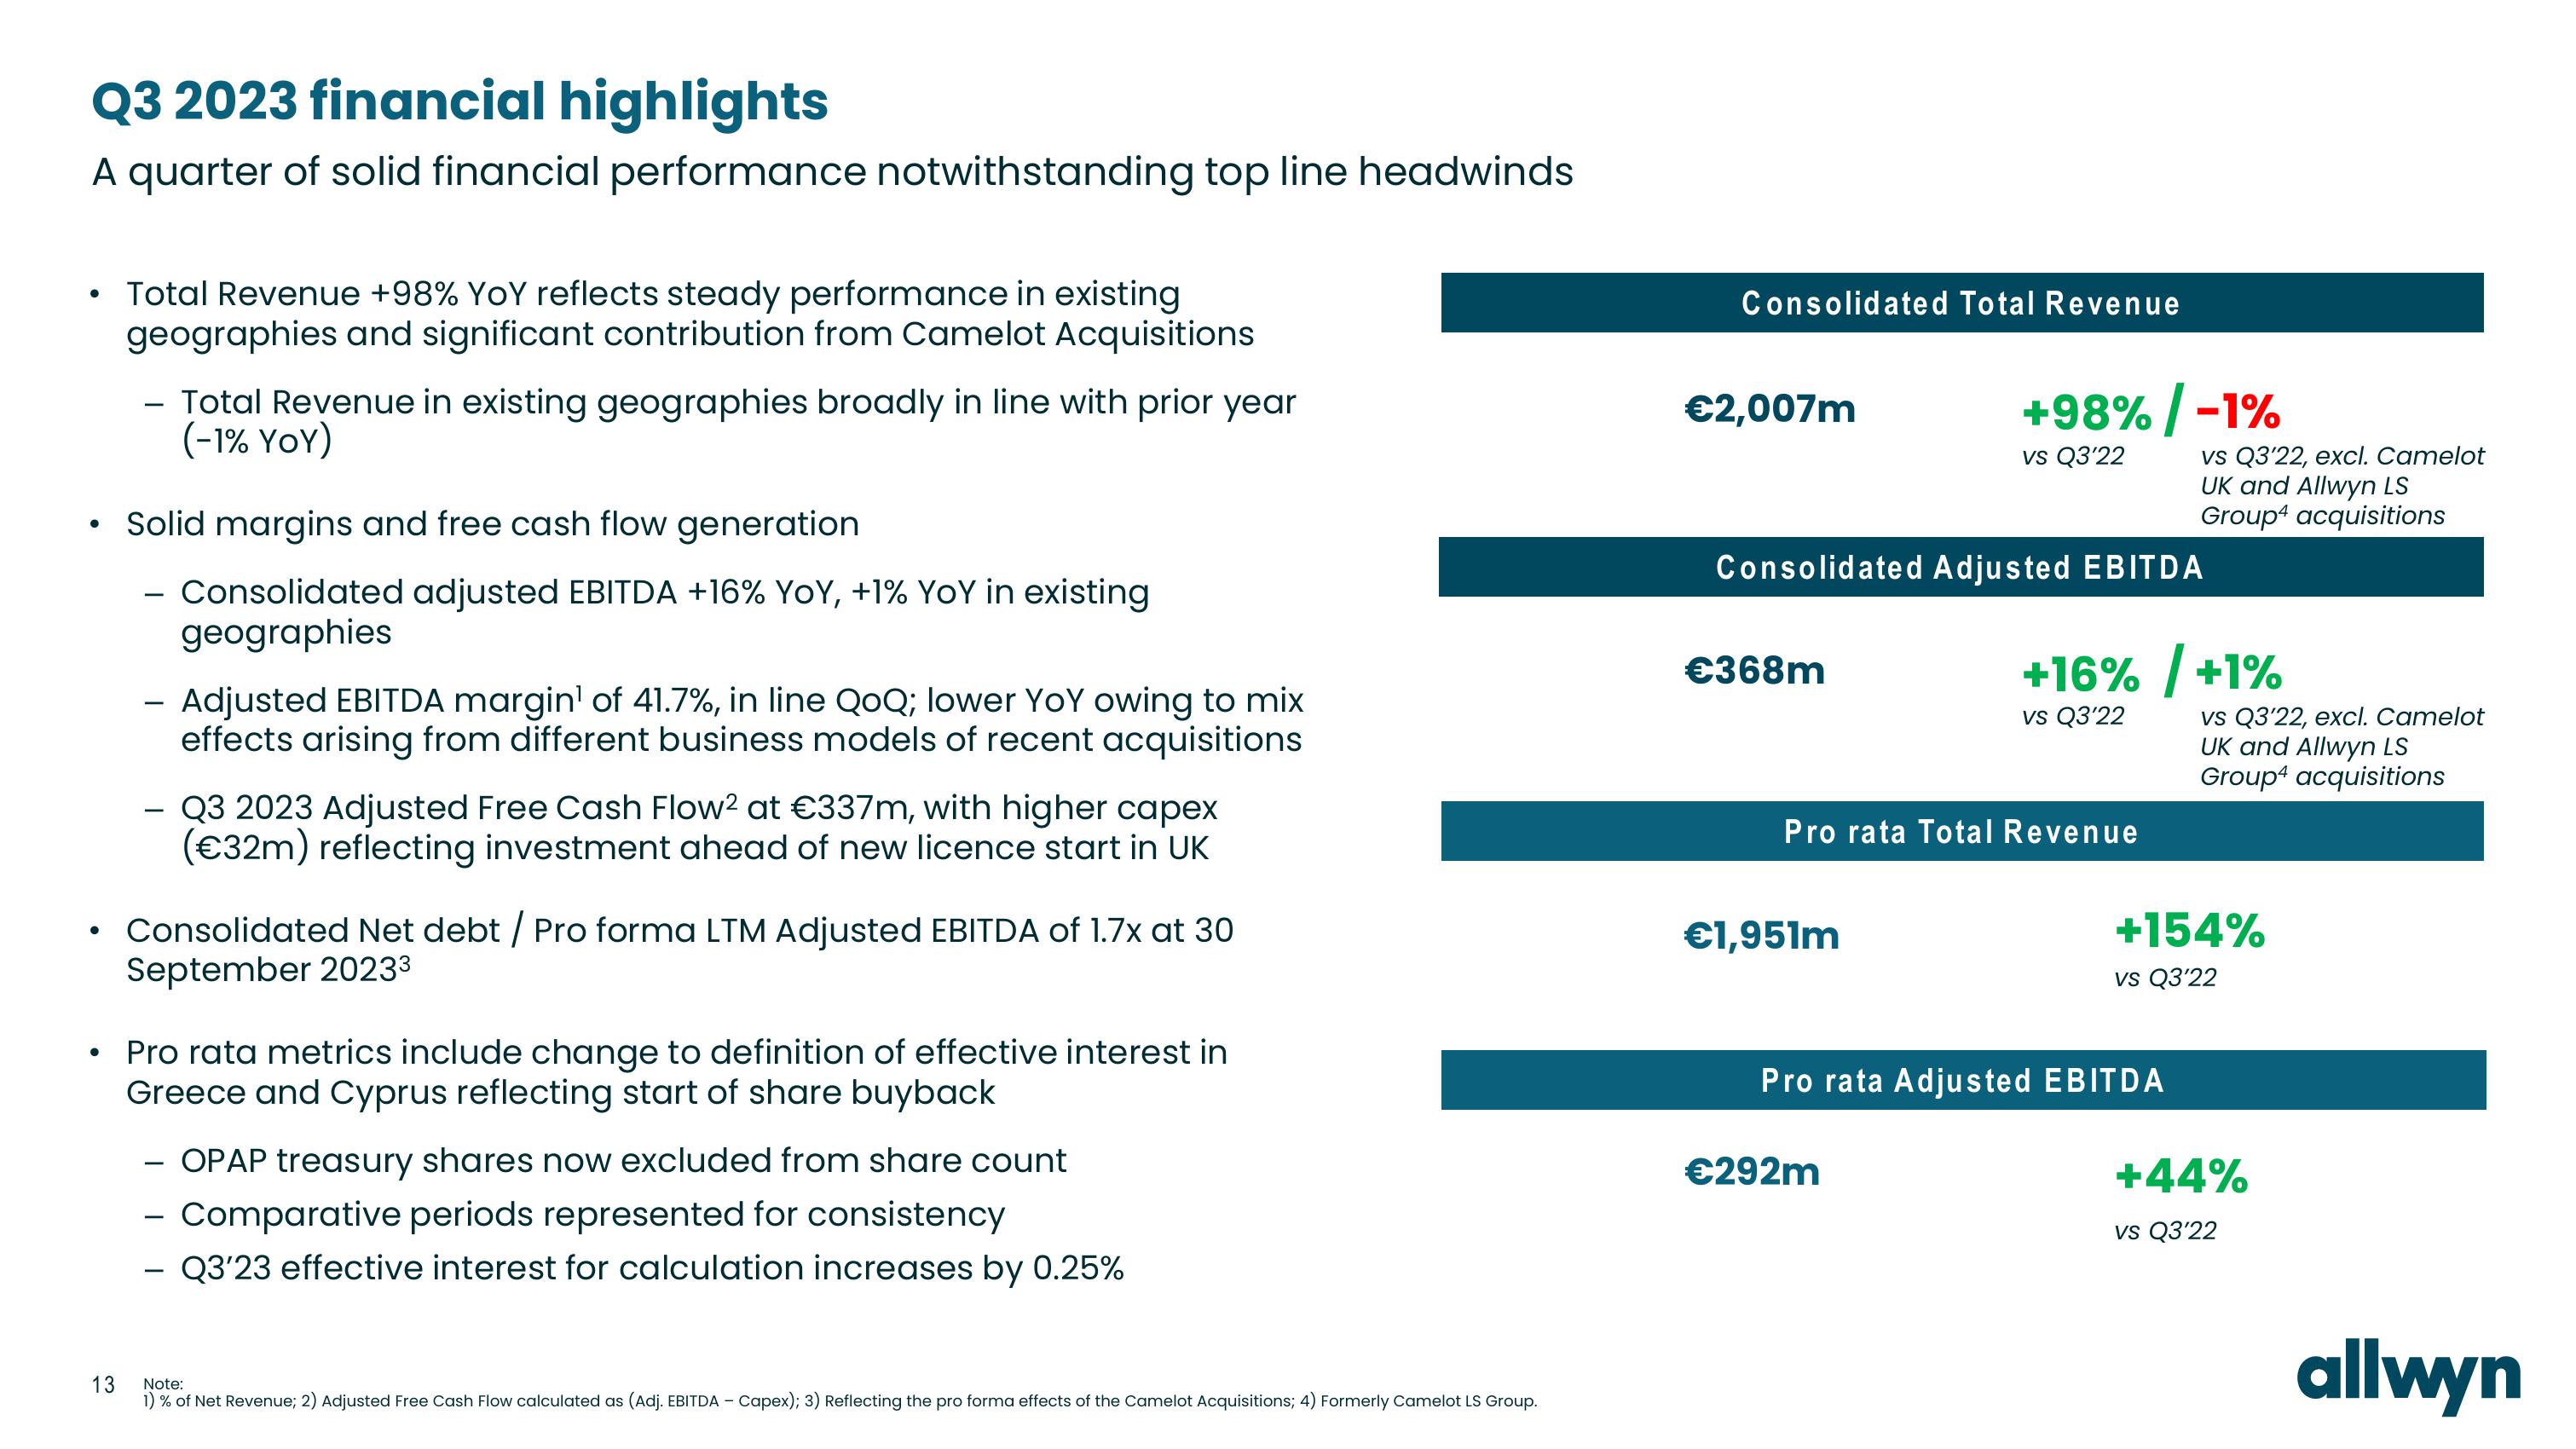
Total Revenue +98% YoY reflects steady performance in existing
geographies and significant contribution from Camelot Acquisitions
- Total Revenue in existing geographies broadly in line with prior year
(-1% YoY)
Solid margins and free cash flow generation
Consolidated adjusted EBITDA +16% YOY, +1% YoY in existing
geographies
-
Adjusted EBITDA margin¹ of 41.7%, in line QoQ; lower YoY owing to mix
effects arising from different business models of recent acquisitions
Q3 2023 Adjusted Free Cash Flow² at €337m, with higher capex
(€32m) reflecting investment ahead of new licence start in UK
Consolidated Net debt / Pro forma LTM Adjusted EBITDA of 1.7x at 30
September 20233
• Pro rata metrics include change to definition of effective interest in
Greece and Cyprus reflecting start of share buyback
OPAP treasury shares now excluded from share count
Comparative periods represented for consistency
Q3'23 effective interest for calculation increases by 0.25%
13
Note:
1) % of Net Revenue; 2) Adjusted Free Cash Flow calculated as (Adj. EBITDA - Capex); 3) Reflecting the pro forma effects of the Camelot Acquisitions; 4) Formerly Camelot LS Group.
Consolidated Total Revenue
€2,007m
€368m
Consolidated Adjusted EBITDA
+98% / -1%
vs Q3'22
€1,951m
Pro rata Total Revenue
€292m
vs Q3'22, excl. Camelot
UK and Allwyn LS
Group4 acquisitions
+16% / +1%
vs Q3'22
Pro rata Adjusted EBITDA
vs Q3'22, excl. Camelot
UK and Allwyn LS
Group4 acquisitions
+154%
vs Q3'22
+44%
vs Q3'22
allwynView entire presentation