Bank of America Investment Banking Pitch Book
SIRE Take Private Analysis
Illustrative Transaction Cash Savings
($ millions, except per unit amounts)
SIRE Publicly Held Units
Public Distributions
Current Annualized SIRE Distribution Per Unit
Annual Distributions Paid to Public SIRE Unitholders
Cash Purchase Price
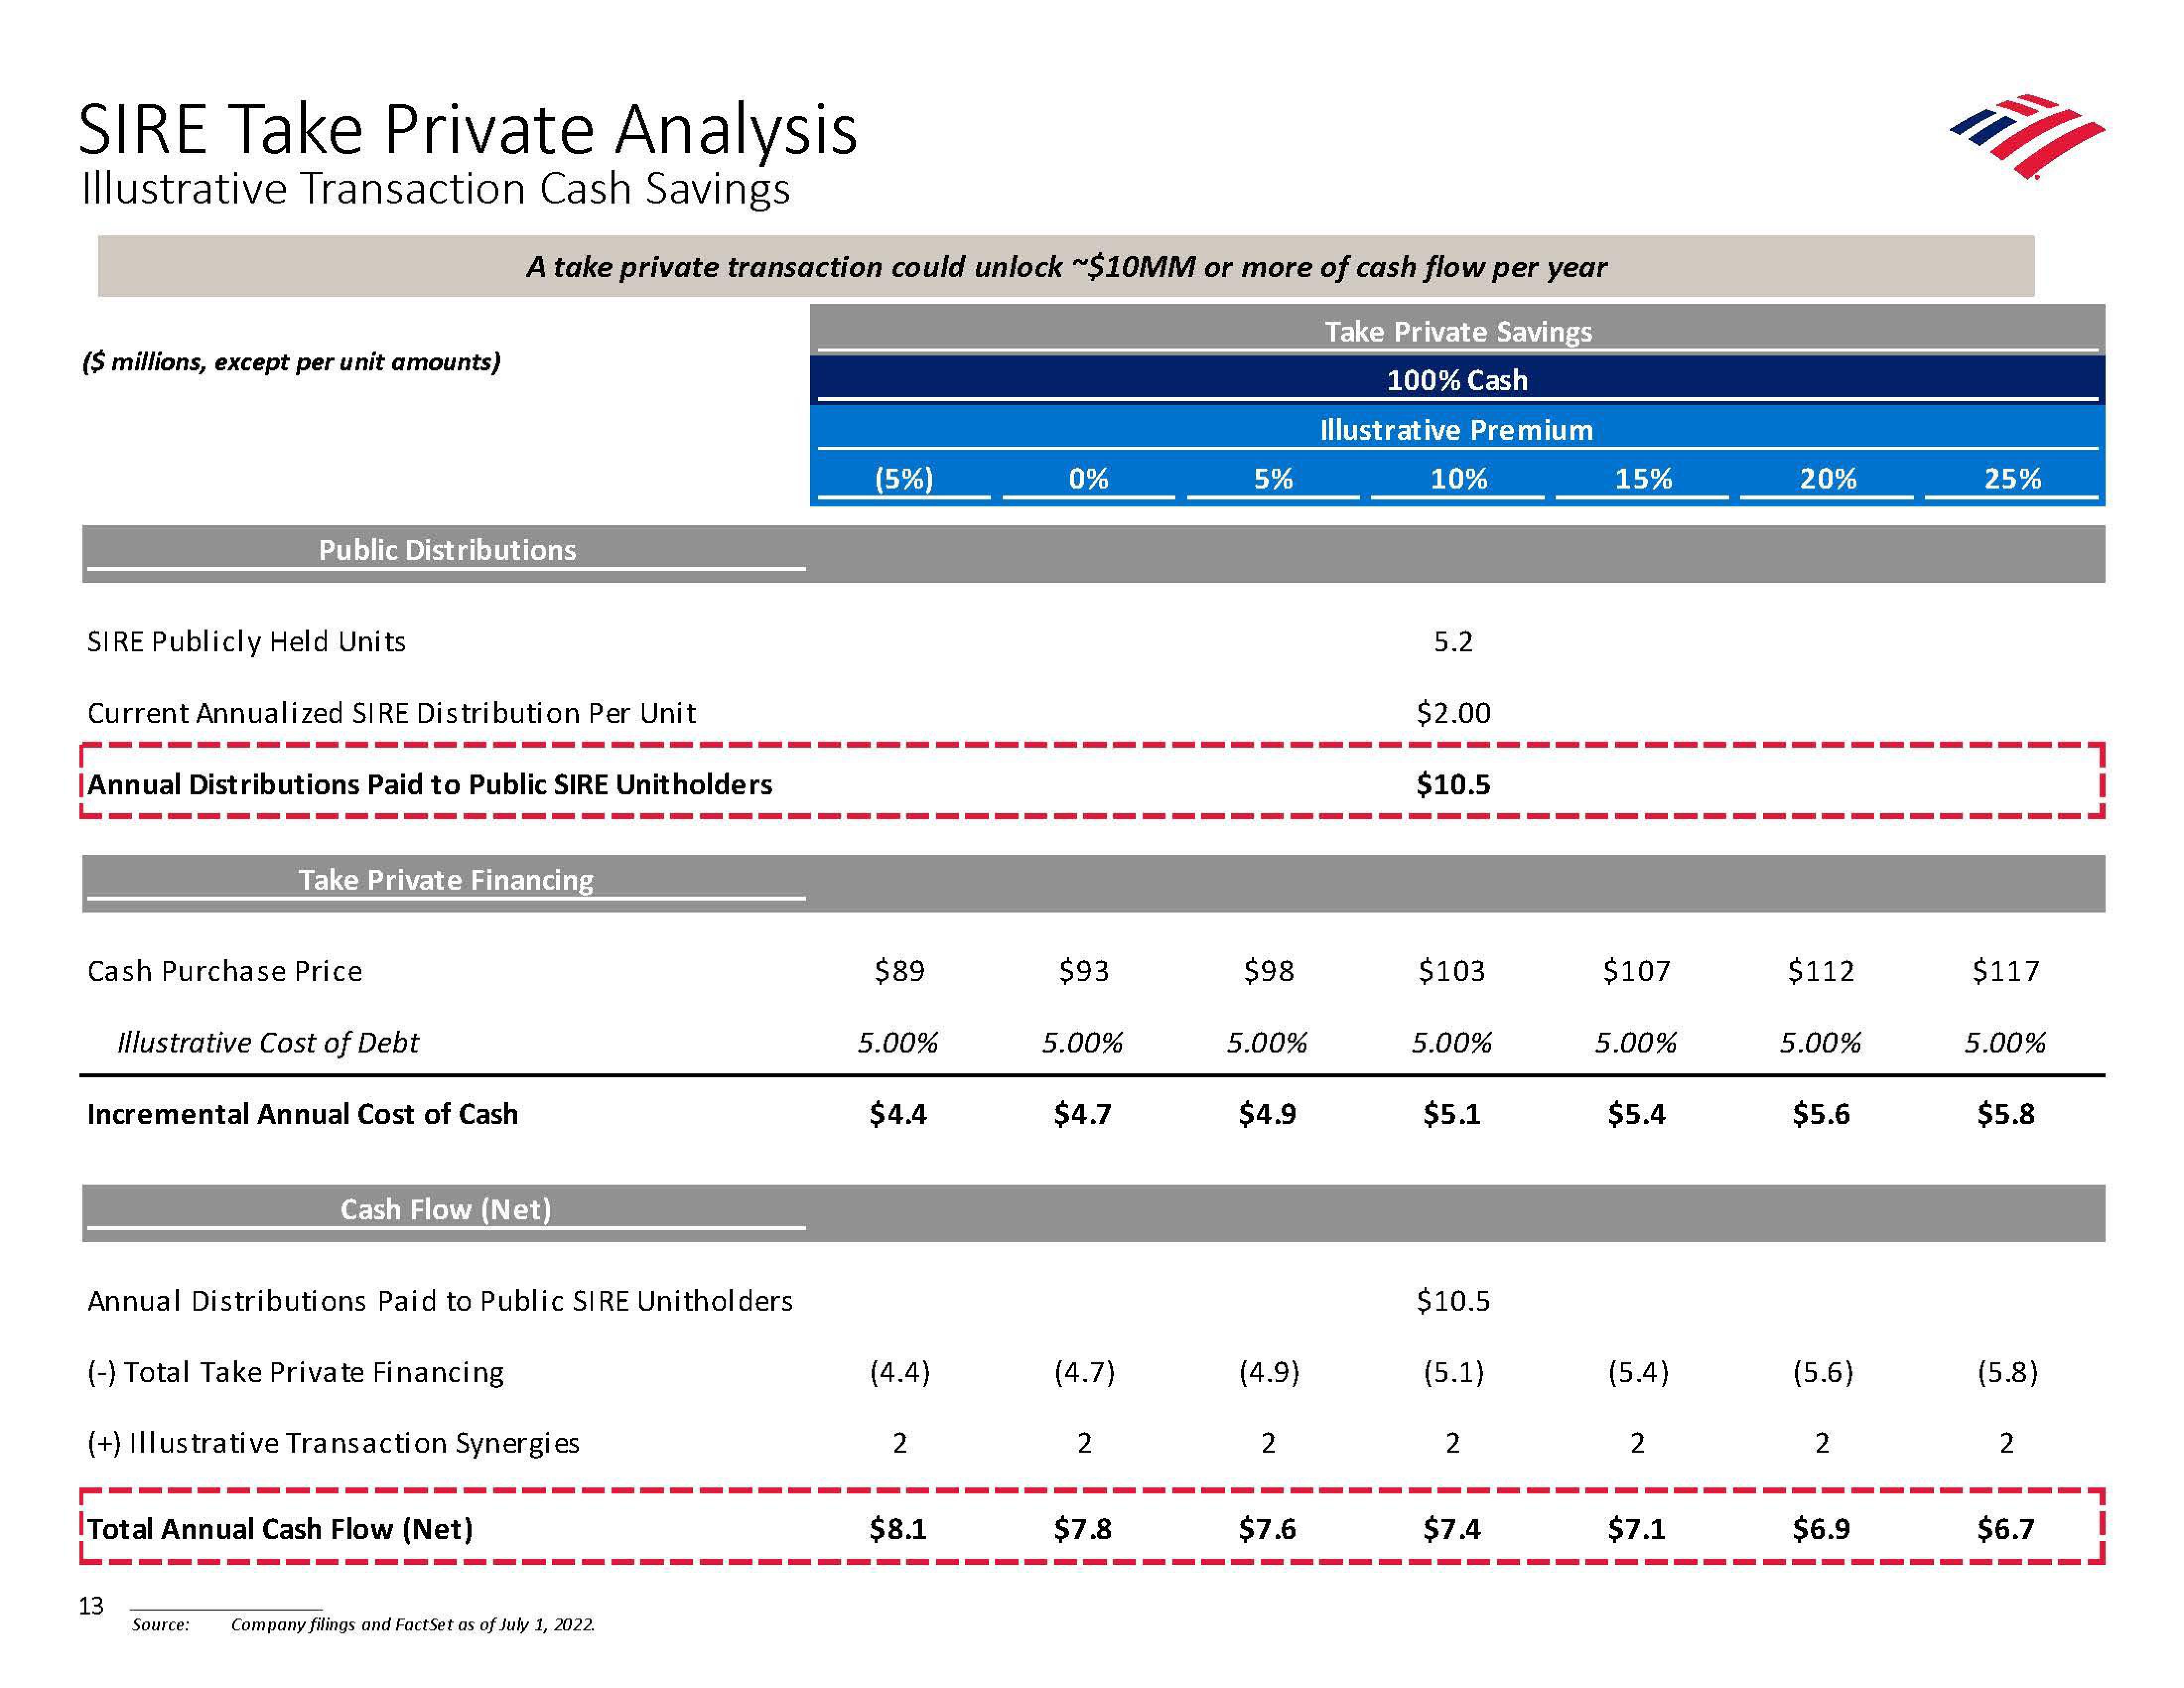
A take private transaction could unlock ~$10MM or more of cash flow per year
Take Private Savings
100% Cash
Illustrative Premium
Take Private Financing
Illustrative Cost of Debt
Incremental Annual Cost of Cash
13
Cash Flow (Net)
Annual Distributions Paid to Public SIRE Unitholders
(-) Total Take Private Financing
(+) Illustrative Transaction Synergies
Total Annual Cash Flow (Net)
Source: Company filings and FactSet as of July 1, 2022.
(5%)
$89
5.00%
$4.4
(4.4)
2
$8.1
0%
$93
5.00%
$4.7
(4.7)
2
$7.8
5%
$98
5.00%
$4.9
(4.9)
2
$7.6
10%
5.2
$2.00
$10.5
$103
5.00%
$5.1
$10.5
(5.1)
2
$7.4
15%
$107
5.00%
$5.4
(5.4)
2
$7.1
20%
$112
5.00%
$5.6
(5.6)
2
$6.9
ill
25%
$117
5.00%
$5.8
(5.8)
2
$6.7View entire presentation