OppFi Results Presentation Deck
3
Record Levels in the Third Quarter
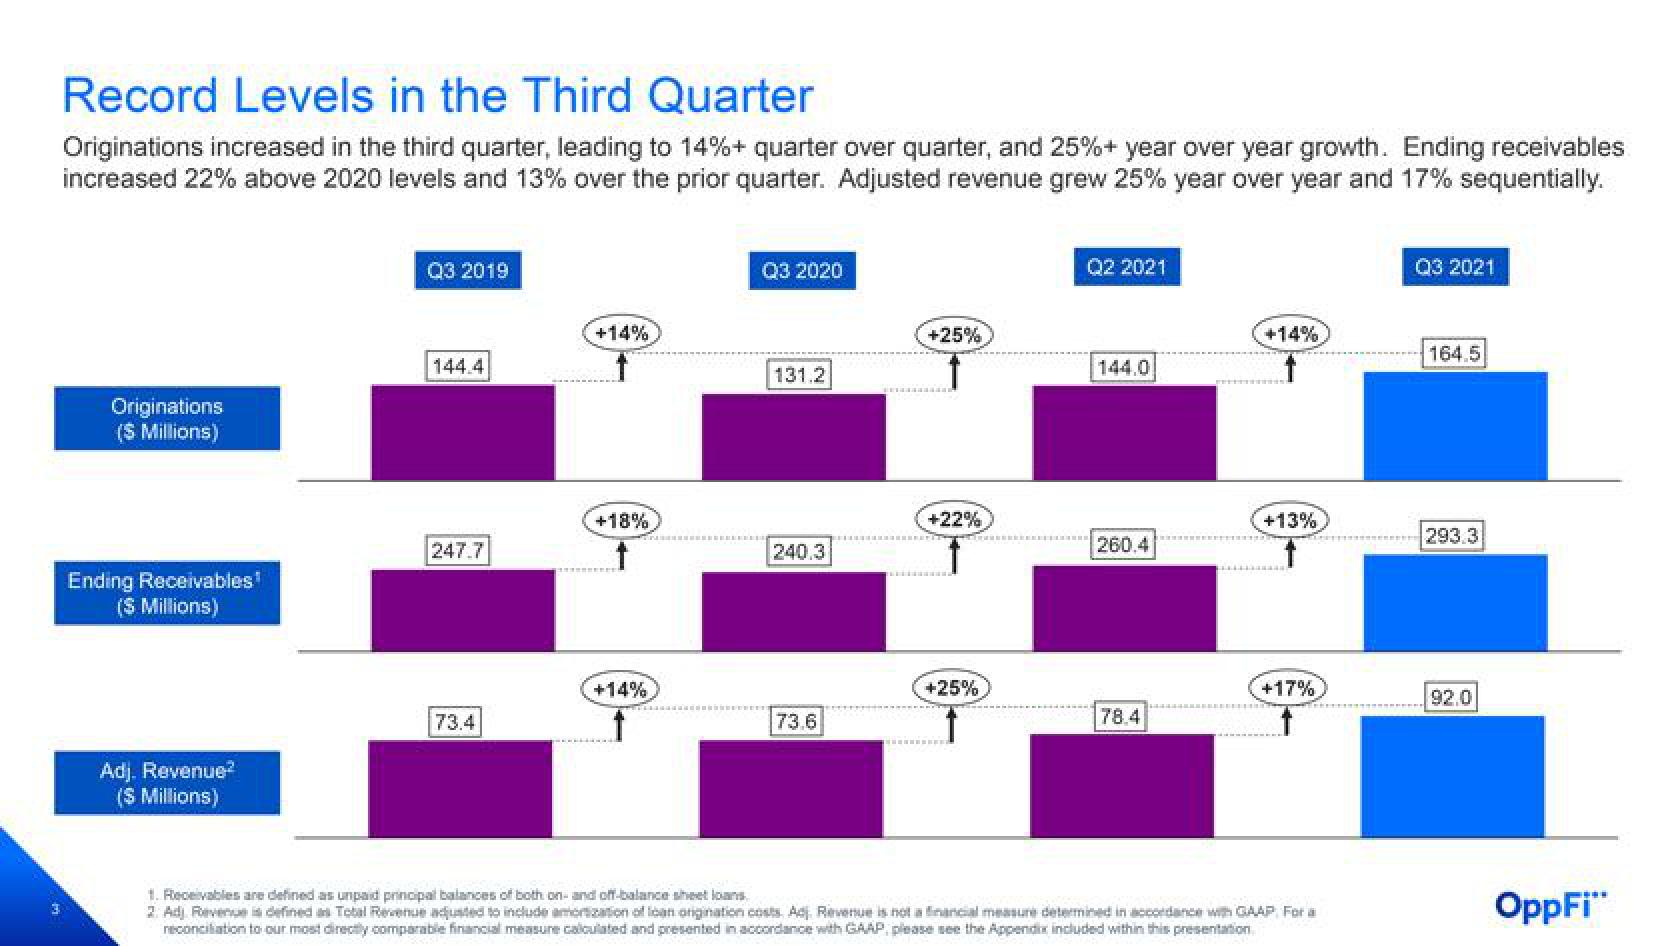
Originations increased in the third quarter, leading to 14% + quarter over quarter, and 25%+ year over year growth. Ending receivables
increased 22% above 2020 levels and 13% over the prior quarter. Adjusted revenue grew 25% year over year and 17% sequentially.
Originations
($ Millions)
Ending Receivables¹
($ Millions)
Adj. Revenue²
($ Millions)
Q3 2019
144.4
247.7
73.4
+14%
↑
+18%
+14%
f
Q3 2020
131.2
240.3
73.6
+25%
+22%
+25%
Q2 2021
260.4
78.4
+14%
+13%
+17%
1. Receivables are defined as unpaid principal balances of both on- and off-balance sheet loans
2. Adj. Revenue is defined as Total Revenue adjusted to include amortization of loan origination costs. Adj. Revenue is not a financial measure determined in accordance with GAAP For a
reconciliation to our most directly comparable financial measure calculated and presented in accordance with GAAP, please see the Appendix included within this presentation
Q3 2021
164.5
293.31
92.0
OppFi"View entire presentation