Metals Acquisition Corp SPAC Presentation Deck
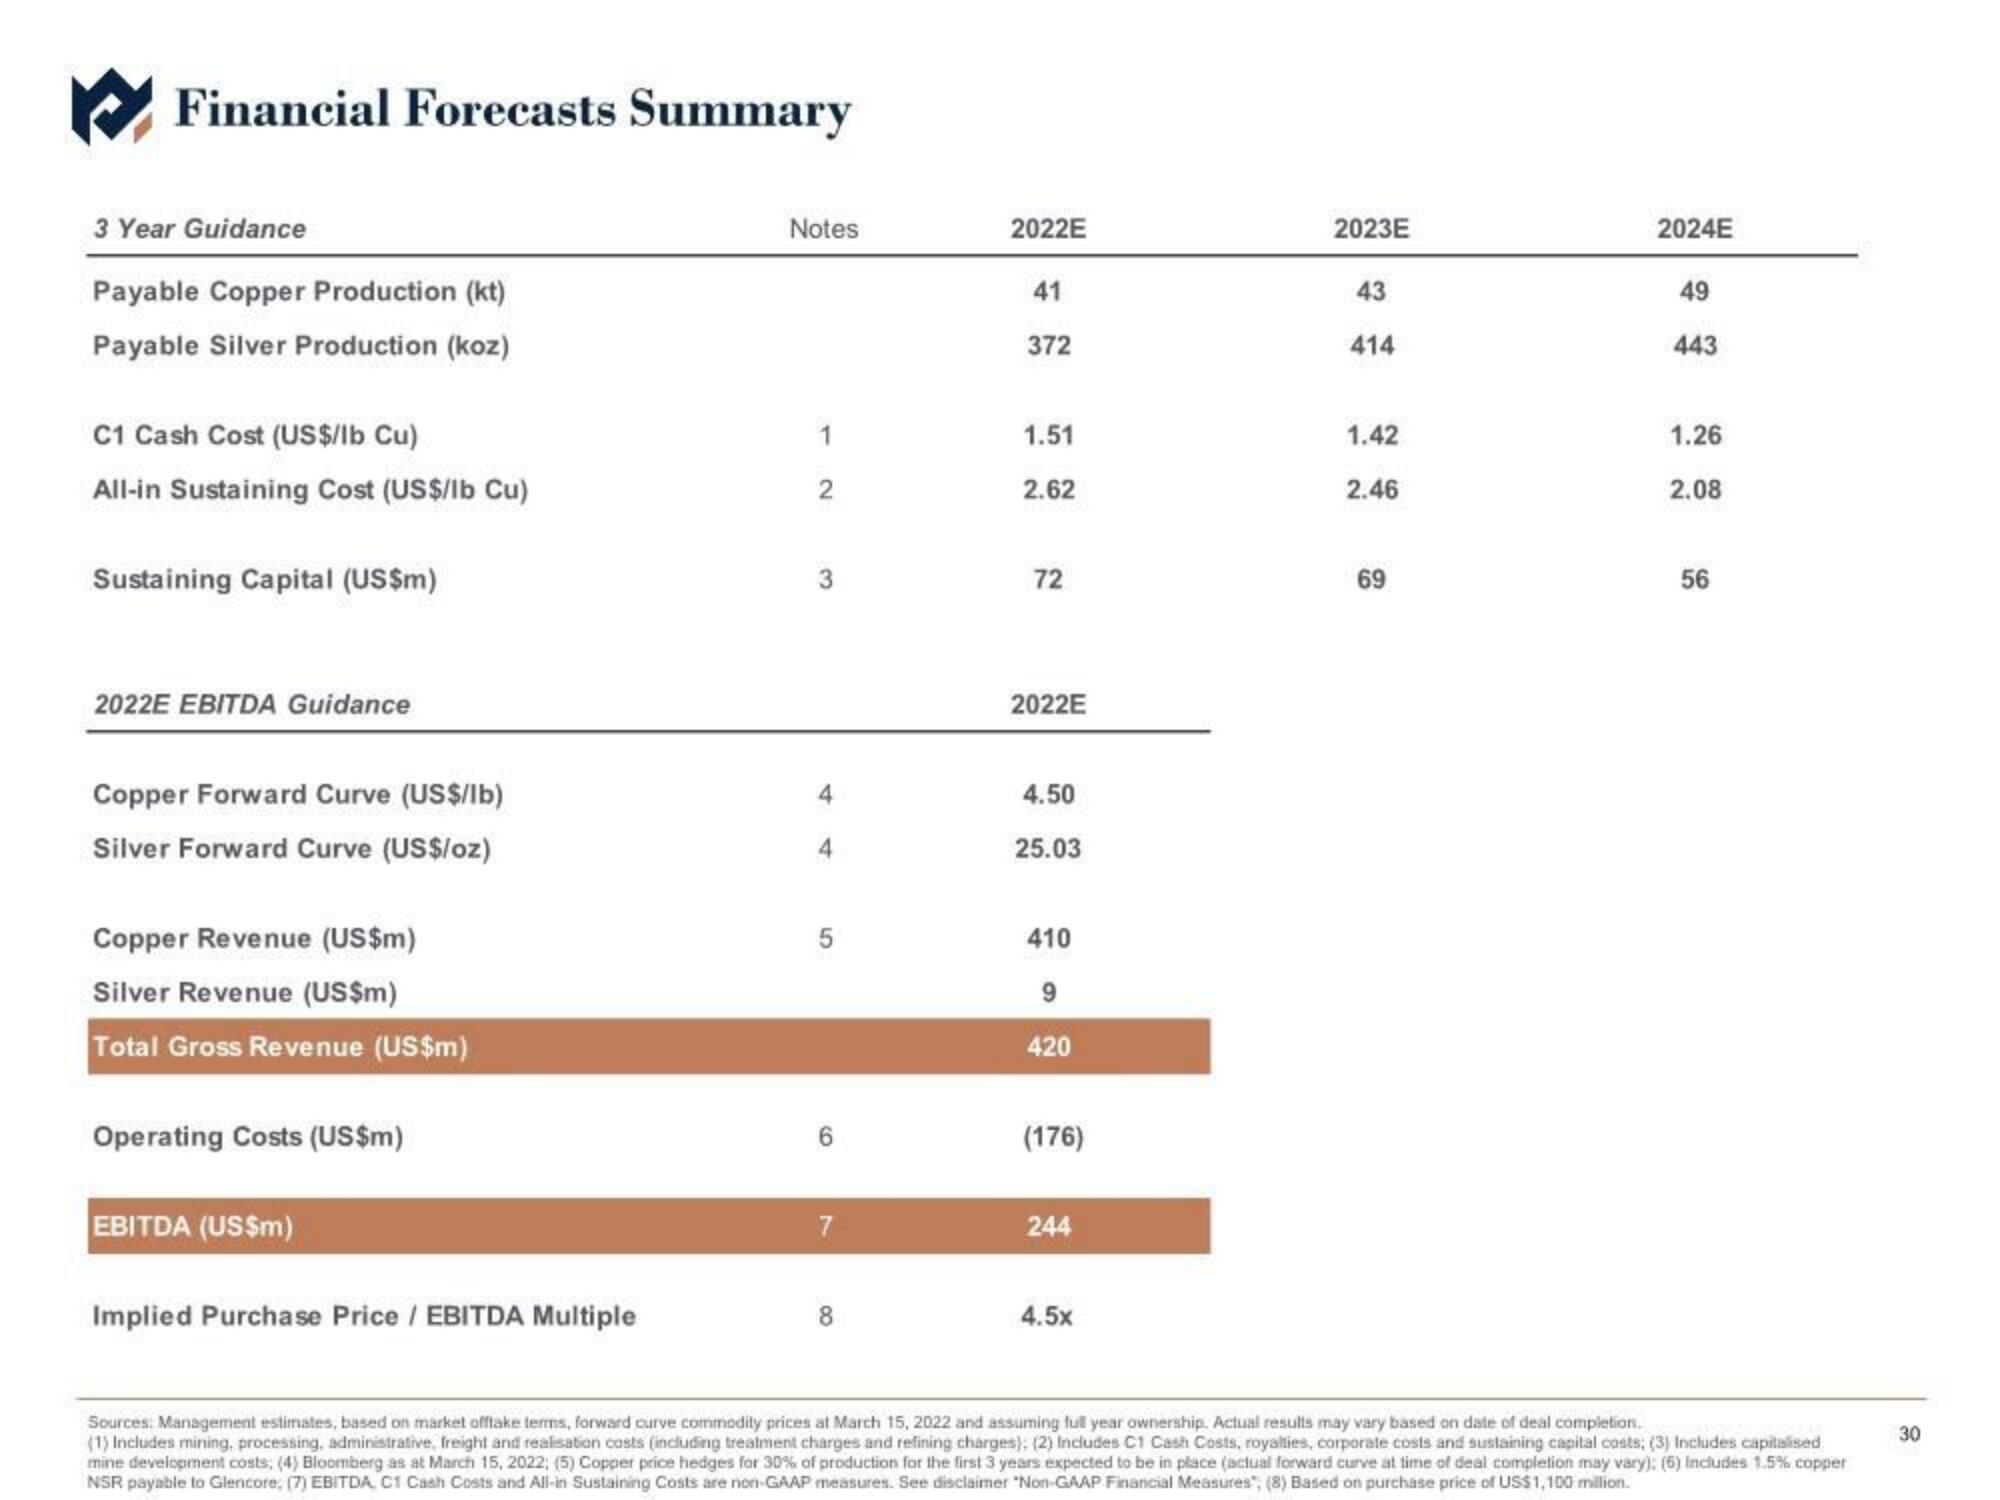
Financial Forecasts Summary
3 Year Guidance
Payable Copper Production (kt)
Payable Silver Production (koz)
C1 Cash Cost (US$/lb Cu)
All-in Sustaining Cost (US$/lb Cu)
Sustaining Capital (US$m)
2022E EBITDA Guidance
Copper Forward Curve (US$/lb)
Silver Forward Curve (US$/oz)
Copper Revenue (US$m)
Silver Revenue (US$m)
Total Gross Revenue (US$m)
Operating Costs (US$m)
EBITDA (US$m)
Implied Purchase Price / EBITDA Multiple
Notes
12
3
4
4
5
7
8
2022E
41
372
1.51
2.62
72
2022E
4.50
25.03
410
9
420
(176)
244
4.5x
2023E
43
414
1.42
2.46
69
2024E
49
443
1.26
2.08
56
Sources: Management estimates, based on market offlake terms, forward curve commodity prices at March 15, 2022 and assuming full year ownership. Actual results may vary based on date of deal completion.
(1) Includes mining, processing, administrative, freight and realisation costs (including treatment charges and refining charges); (2) Includes C1 Cash Costs, royalties, corporate costs and sustaining capital costs; (3) Includes capitalised
mine development costs; (4) Bloomberg as at March 15, 2022; (5) Copper price hedges for 30% of production for the first 3 years expected to be in place (actual forward curve at time of deal completion may vary): (5) Includes 1.5% copper
NSR payable to Glencore, (7) EBITDA, C1 Cash Costs and All-in Sustaining Costs are non-GAAP measures. See disclaimer "Non-GAAP Financial Measures"; (8) Based on purchase price of US$1,100 million.
30View entire presentation