Paysafe Results Presentation Deck
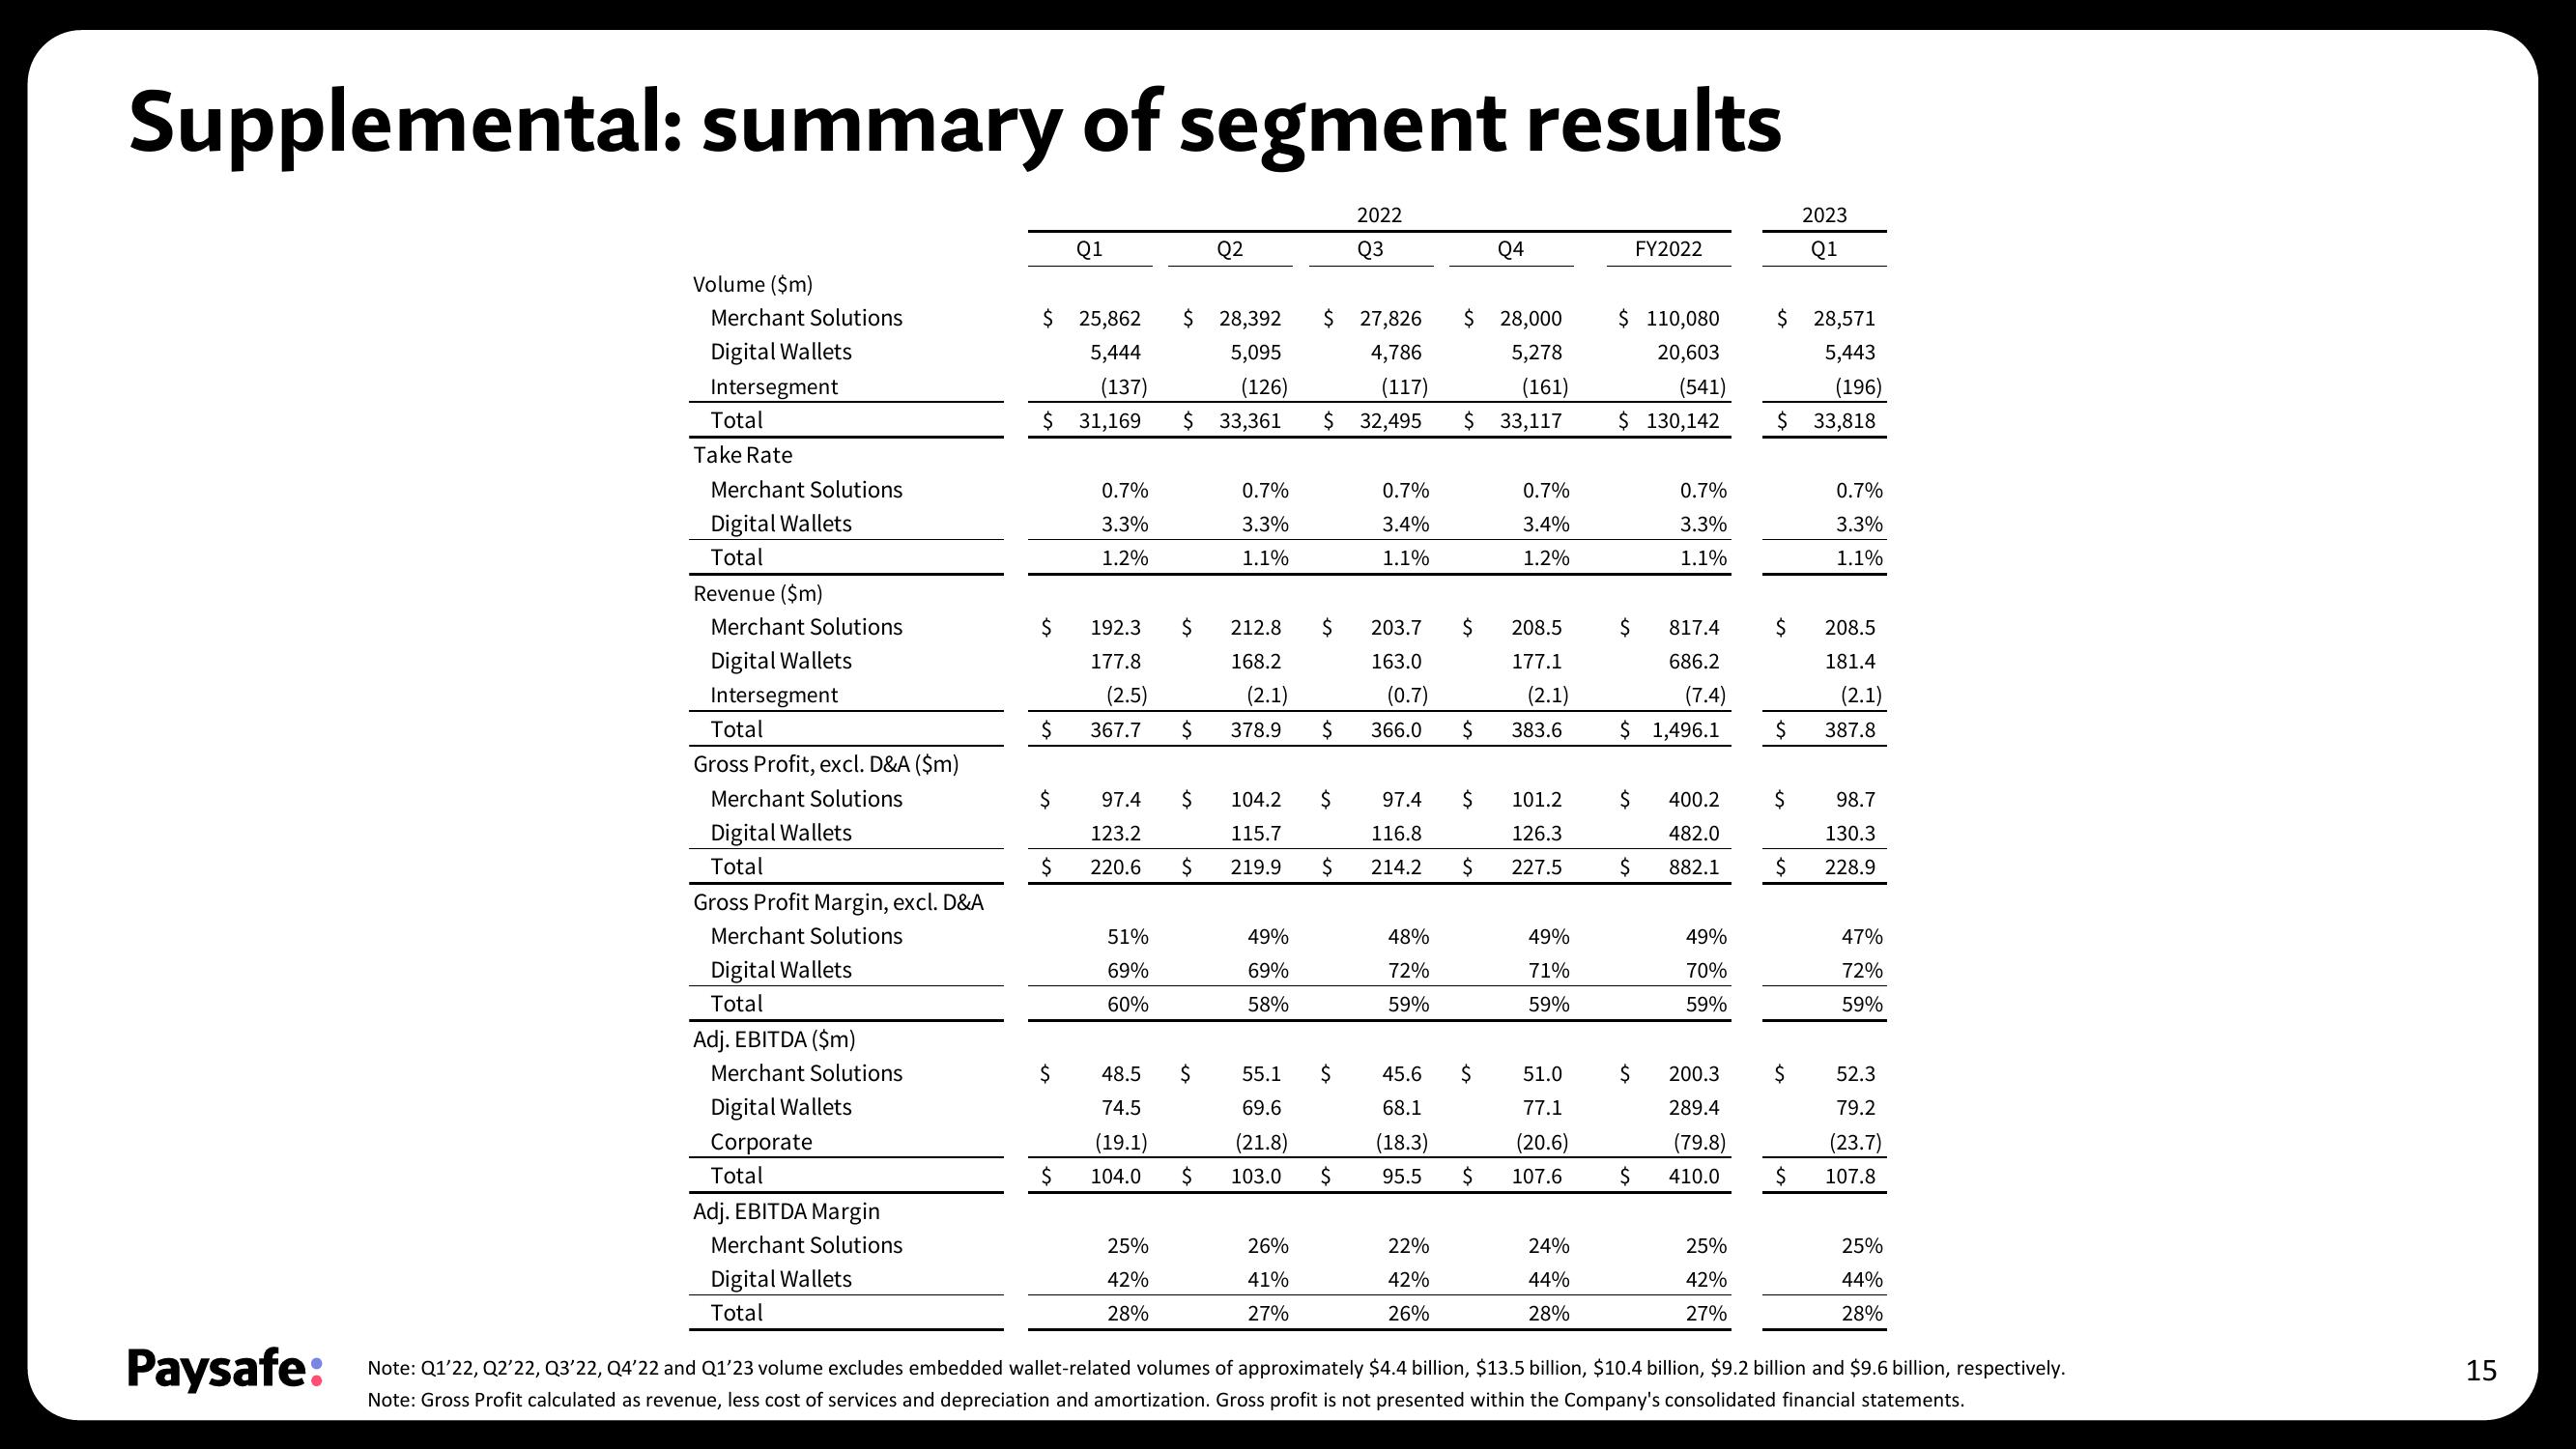
Supplemental: summary of segment results
Paysafe:
Volume ($m)
Merchant Solutions
Digital Wallets
Intersegment
Total
Take Rate
Merchant Solutions
Digital Wallets
Total
Revenue ($m)
Merchant Solutions
Digital Wallets
Intersegment
Total
Gross Profit, excl. D&A ($m)
Merchant Solutions
Digital Wallets
Total
Gross Profit Margin, excl. D&A
Merchant Solutions
Digital Wallets
Total
Adj. EBITDA ($m)
Merchant Solutions
Digital Wallets
Corporate
Total
Adj. EBITDA Margin
Merchant Solutions
Digital Wallets
Total
$
$ 25,862 $ 28,392
5,444
5,095
$
$
$
$
$
Q1
$
(137)
31,169
0.7%
3.3%
1.2%
192.3
177.8
(2.5)
367.7 $
51%
69%
60%
97.4 $
123.2
220.6
48.5
74.5
(19.1)
104.0
(126)
$ 33,361
$
25%
42%
28%
Q2
$
$
0.7%
3.3%
1.1%
378.9
212.8 $
168.2
(2.1)
49%
69%
58%
$
$ 27,826 $ 28,000
4,786
5,278
(161)
(117)
32,495
$ 33,117
26%
41%
27%
$
55.1 $
69.6
(21.8)
$ 103.0 $
2022
Q3
0.7%
3.4%
1.1%
104.2 $
115.7
101.2
126.3
219.9 $ 214.2 $ 227.5
97.4 $
116.8
Q4
203.7
163.0
(0.7)
366.0 $ 383.6
208.5
177.1
(2.1)
48%
72%
59%
$
0.7%
3.4%
1.2%
22%
42%
26%
49%
71%
59%
45.6 $ 51.0
68.1
(18.3)
77.1
(20.6)
95.5 $ 107.6
24%
44%
28%
$ 110,080
20,603
(541)
$ 130,142
$
FY2022
817.4
686.2
(7.4)
$ 1,496.1
$
$ 400.2
482.0
882.1
$
0.7%
3.3%
1.1%
$
49%
70%
59%
200.3
289.4
(79.8)
410.0
25%
42%
27%
$ 28,571
5,443
(196)
$ 33,818
$
$
$
$
2023
Q1
$
0.7%
3.3%
1.1%
208.5
181.4
(2.1)
387.8
98.7
130.3
228.9
47%
72%
59%
52.3
79.2
(23.7)
$ 107.8
25%
44%
28%
Note: Q1'22, Q2'22, Q3'22, Q4'22 and Q1'23 volume excludes embedded wallet-related volumes of approximately $4.4 billion, $13.5 billion, $10.4 billion, $9.2 billion and $9.6 billion, respectively.
Note: Gross Profit calculated as revenue, less cost of services and depreciation and amortization. Gross profit is not presented within the Company's consolidated financial statements.
15View entire presentation