Credit Suisse Investment Banking Pitch Book
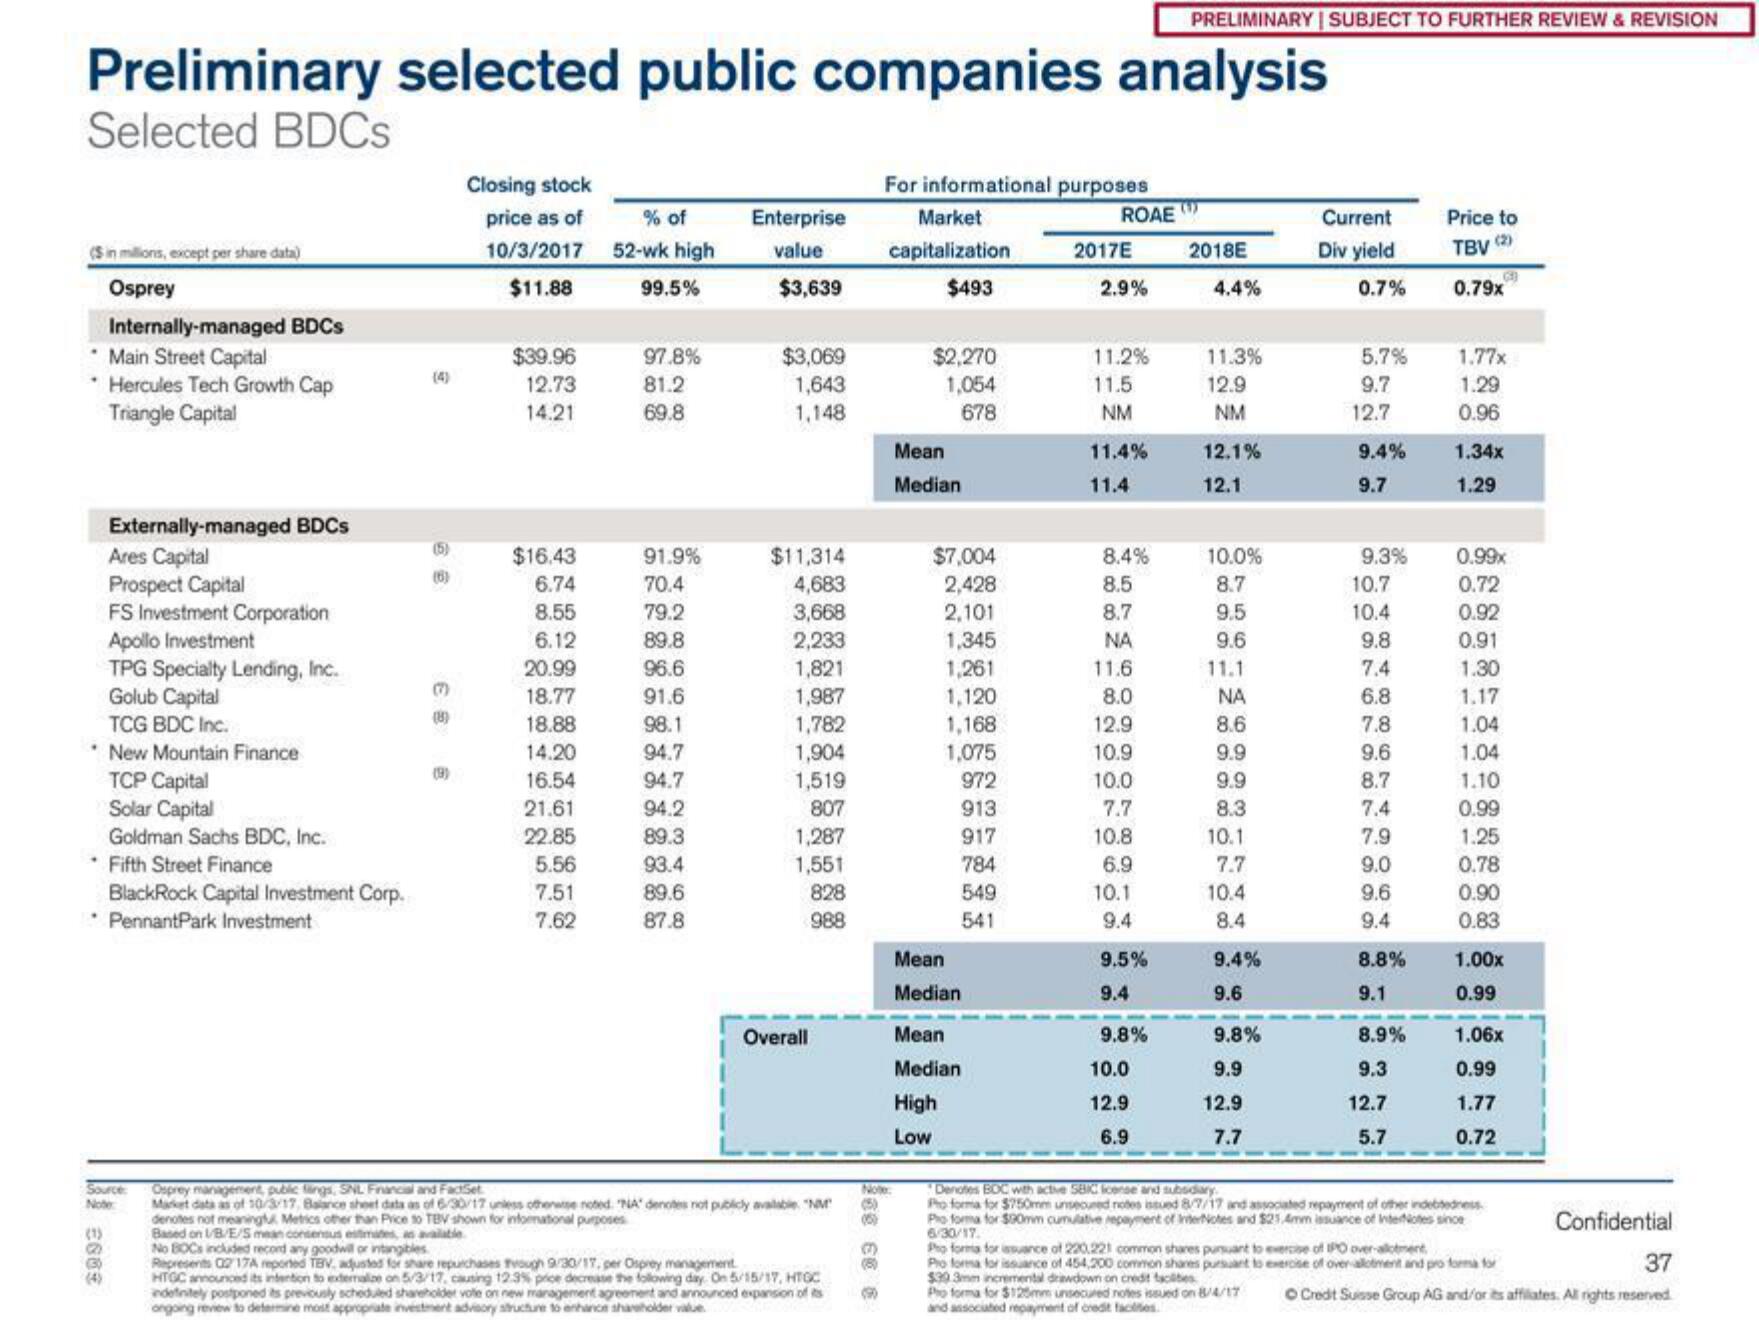
Preliminary selected public companies analysis
Selected BDCs
(Sin millions, except per share data)
Osprey
Internally-managed BDCs
Main Street Capital
* Hercules Tech Growth Cap
Triangle Capital
.
(1)
B
Externally-managed BDCs
Ares Capital
Prospect Capital
(3)
(4)
FS Investment Corporation
Apollo Investment
TPG Specialty Lending, Inc.
Golub Capital
TCG BDC Inc.
New Mountain Finance
TCP Capital
Solar Capital
Goldman Sachs BDC, Inc.
Source:
Note
Fifth Street Finance
BlackRock Capital Investment Corp.
PennantPark Investment
(8)
(9)
Closing stock
% of
price as of
10/3/2017 52-wk high
$11.88
99.5%
$39.96
12.73
14.21
$16.43
6.74
8.55
6.12
20.99
18.77
18.88
14.20
16.54
21.61
22.85
5.56
7.51
7.62
97.8%
81.2
69.8
91.9%
70.4
79.2
89.8
96.6
91.6
98.1
94.7
94.7
94.2
89.3
93.4
89.6
87.8
Enterprise
value
$3,639
$3,069
1,643
1,148
$11,314
4,683
3,668
2,233
1,821
1,987
1,782
1,904
1,519
807
1,287
1,551
828
988
Overall
Osprey management, public lings, SNL Financial and FactSet
Market data as of 10/3/17, Balance sheet data as of 6/30/17 unless otherwise noted. "NA" denotes not publicly available. "N
denotes not meaninglu Metrics other than Price to TBV shown for informational purposes
Based on 1/B/E/S mean consensus estimates, as available
No BOCs included record any goodwill or intangibles
Represents 02 17A reported TBV. adjusted for share repurchases Tough 9/30/17, per Osprey management
HTGC announced its intention to externalize on 5/3/17, causing 12.3% price decrease the following day. On 5/15/17, HTGC
indefinitely postponed its previously scheduled shareholder vote on new management agreement and announced expansion of its
ongoing review to determine most appropriate investment advisory structure to enhance shareholder value
Note
(5)
(5)
60 6
For informational purposes
Market
ROAE
capitalization
$493
(90
$2,270
1,054
678
Mean
Median
$7,004
2,428
2,101
1,345
1,261
1,120
1,168
1,075
972
913
917
784
549
541
Mean
Median
Mean
Median
High
Low
2017E
2.9%
11.2%
11.5
NM
11.4%
11.4
8.4%
8.5
8.7
NA
11.6
8.0
12.9
10.9
10.0
7.7
10.8
6.9
10.1
9.4
9.5%
9.4
9.8%
PRELIMINARY | SUBJECT TO FURTHER REVIEW & REVISION
10.0
12.9
6.9
2018E
4.4%
11.3%
12.9
NM
12.1%
12.1
10.0%
8.7
9.5
9.6
11.1
ΝΑ
8.6
9.9
9.9
8.3
10.1
7.7
10.4
8.4
9.4%
9.6
9.8%
9.9
12.9
7.7
Current
Div yield
0.7%
5.7%
9.7
12.7
9.4%
9.7
9.3%
10.7
10.4
9.8
7.4
6.8
7.8
9.6
8.7
7.4
7.9
9.0
9.6
9.4
8.8%
9.1
8.9%
9.3
12.7
5.7
Price to
TBV (2)
0.79x
1.77x
1.29
0.96
1.34x
1.29
0.99x
0.72
0.92
0.91
1.30
1.17
1.04
1.04
1.10
0.99
1.25
0.78
0.90
0.83
1.00x
0.99
1.06x
0.99
1.77
0.72
Denotes BOC with active S8C license and subsidiary
Pro forma for $750mm unsecured notes issued 8/7/17 and associated repayment of other indebtedness
Pho forma for $90mm cumulative repayment of InterNotes and $21.4mm issuance of InterNotes since
6/30/17.
Pho forma for issuance of 220,221 common shares pursuant to exercise of IPO over-alotment
Pro forma for issuance of 454,200 common shares pursuant to exercise of over allotment and pro forma for
$39 3mm incremental drawdown on credit scles
Pro forma for $125mm unsecured notes issued on 8/4/17
and associated repayment of credit facilities.
Confidential
37
Ⓒ Credit Suisse Group AG and/or its affiliates. All rights reservedView entire presentation