Comcast Results Presentation Deck
Content &
Experiences
Revenue ($B)
6
$10.5
3Q22
$1.8
$10.6
3Q22
+0.8%
Adj. EBITDA ($B)
3Q23
$2.0
+10.2%
3Q23
All percentages represent year/year growth rates.
See Notes on Slide 10
($M)
Media
Studios
Theme Parks
3Q 2023
Revenue
y/y%
$6,029
+0.4%
$2,518
(23.6%)
$2,418
+17.2%
3Q 2023
Adj. EBITDA
y/y%
$723
+6.5%
$429
(22.2%)
$983
+20.0%
●
●
●
●
●
●
Commentary
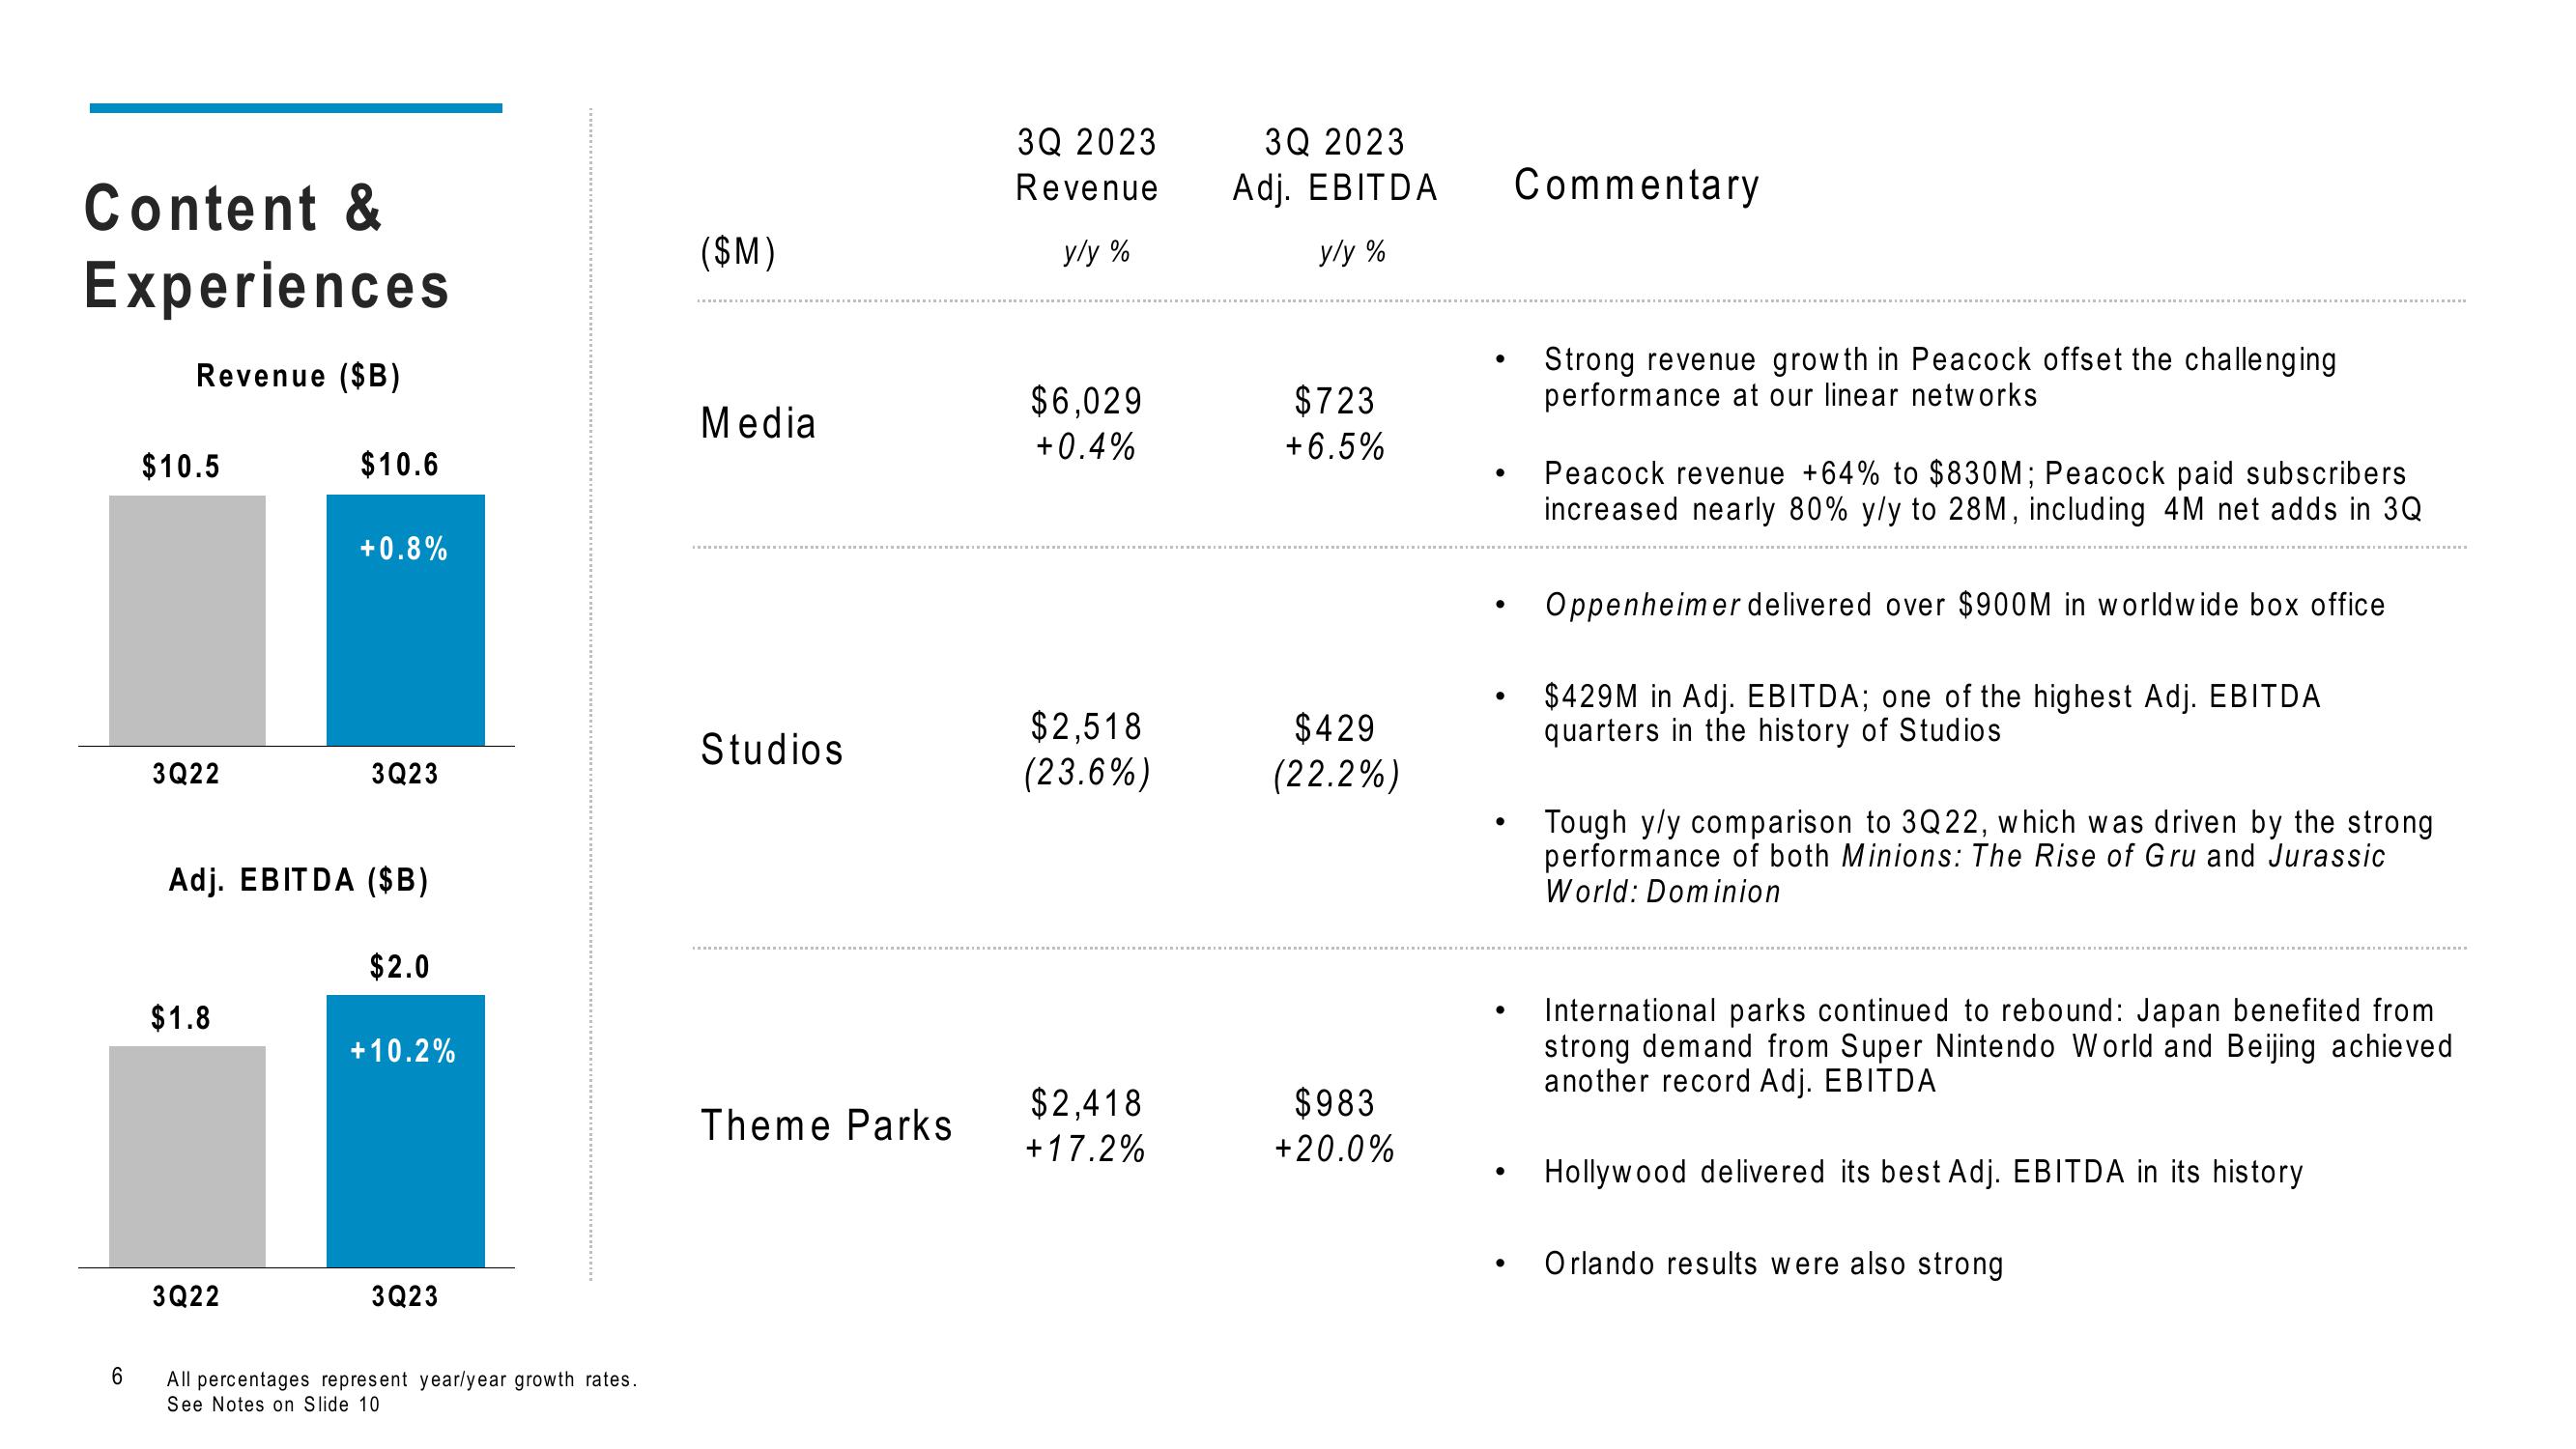
Strong revenue growth in Peacock offset the challenging
performance at our linear networks
Peacock revenue +64% to $830M; Peacock paid subscribers
increased nearly 80% y/y to 28M, including 4M net adds in 3Q
Oppenheimer delivered over $900M in worldwide box office
$429M in Adj. EBITDA; one of the highest Adj. EBITDA
quarters in the history of Studios
Tough y/y comparison to 3Q22, which was driven by the strong
performance of both Minions: The Rise of Gru and Jurassic
World: Dominion
International parks continued to rebound: Japan benefited from
strong demand from Super Nintendo World and Beijing achieved
another record Adj. EBITDA
Hollywood delivered its best Adj. EBITDA in its history
Orlando results were also strongView entire presentation