Silicon Valley Bank Results Presentation Deck
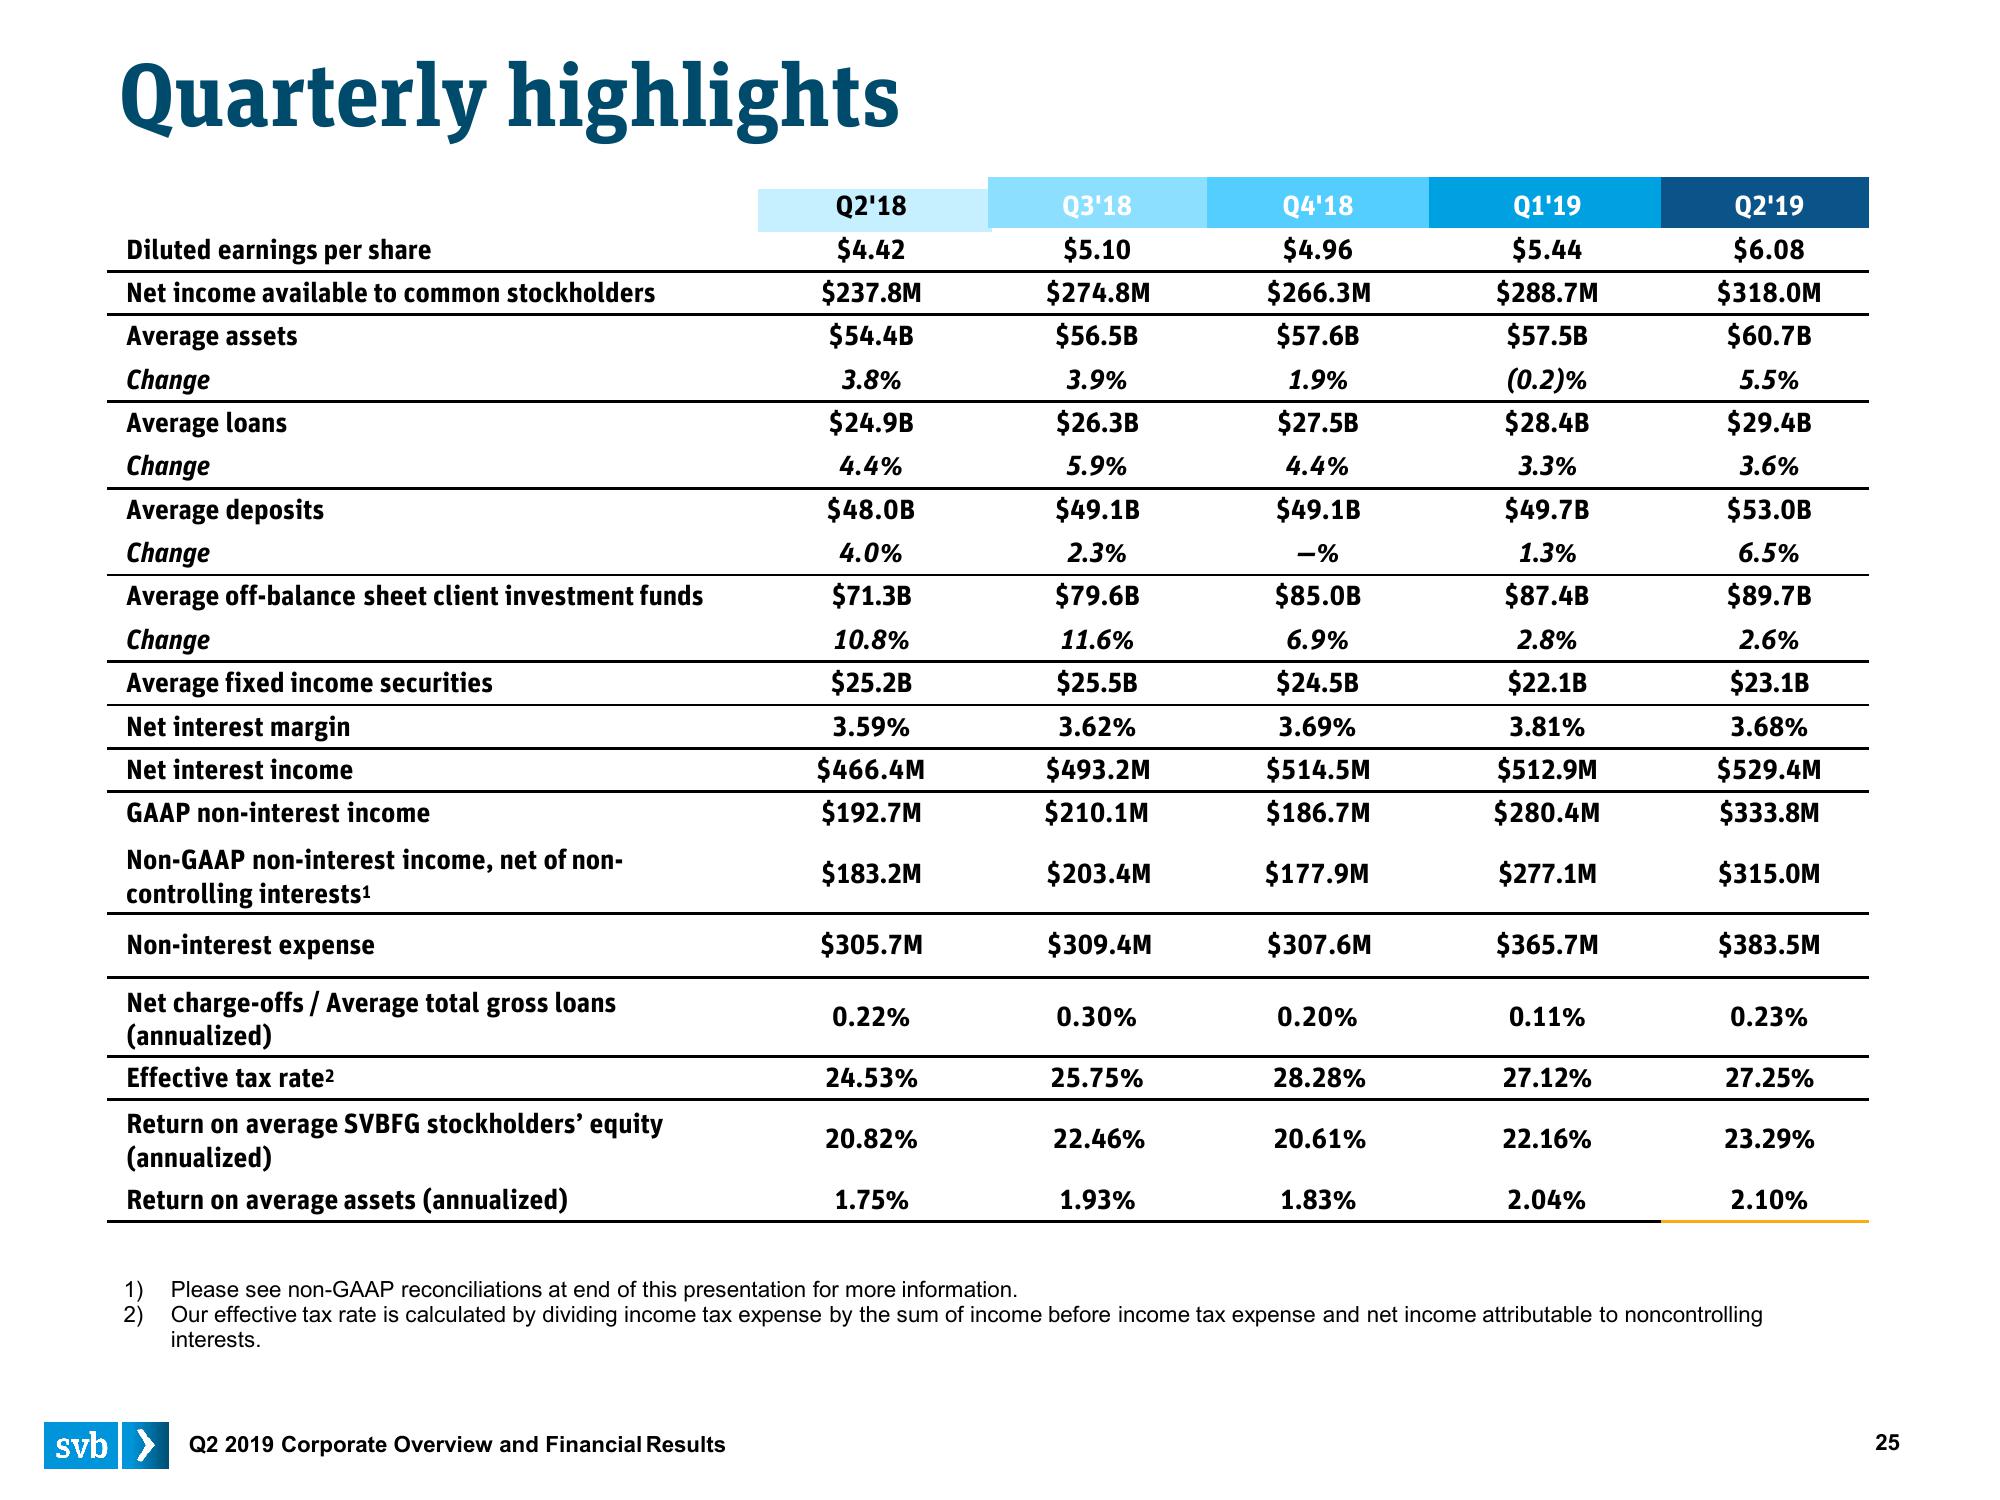
Quarterly highlights
Diluted earnings per share
Net income available to common stockholders
Average assets
Change
Average loans
Change
Average deposits
Change
Average off-balance sheet client investment funds
Change
Average fixed income securities
Net interest margin
Net interest income
GAAP non-interest income
Non-GAAP non-interest income, net of non-
controlling interests¹
Non-interest expense
Net charge-offs / Average total gross loans
(annualized)
Effective tax rate²
Return on average SVBFG stockholders' equity
(annualized)
Return on average assets (annualized)
1)
2)
Q2'18
$4.42
$237.8M
$54.4B
3.8%
$24.9B
4.4%
$48.0B
4.0%
$71.3B
10.8%
$25.2B
3.59%
$466.4M
$192.7M
$183.2M
$305.7M
svb> Q2 2019 Corporate Overview and Financial Results
0.22%
24.53%
20.82%
1.75%
Q3'18
$5.10
$274.8M
$56.5B
3.9%
$26.3B
5.9%
$49.1B
2.3%
$79.6B
11.6%
$25.5B
3.62%
$493.2M
$210.1M
$203.4M
$309.4M
0.30%
25.75%
22.46%
1.93%
Q4'18
$4.96
$266.3M
$57.6B
1.9%
$27.5B
4.4%
$49.1B
-%
$85.0B
6.9%
$24.5B
3.69%
$514.5M
$186.7M
$177.9M
$307.6M
0.20%
28.28%
20.61%
1.83%
Q1'19
$5.44
$288.7M
$57.5B
(0.2)%
$28.4B
3.3%
$49.7B
1.3%
$87.4B
2.8%
$22.1B
3.81%
$512.9M
$280.4M
$277.1M
$365.7M
0.11%
27.12%
22.16%
2.04%
Q2'19
$6.08
$318.0M
$60.7B
5.5%
$29.4B
3.6%
$53.0B
6.5%
$89.7B
2.6%
$23.1B
3.68%
$529.4M
$333.8M
$315.0M
$383.5M
0.23%
27.25%
23.29%
2.10%
Please see non-GAAP reconciliations at end of this presentation for more information.
Our effective tax rate is calculated by dividing income tax expense by the sum of income before income tax expense and net income attributable to noncontrolling
interests.
25View entire presentation