AlTi SPAC Presentation Deck
AITI Stability, profitability, & growth
ALVARIUM TIEDEMANN CAPITAL
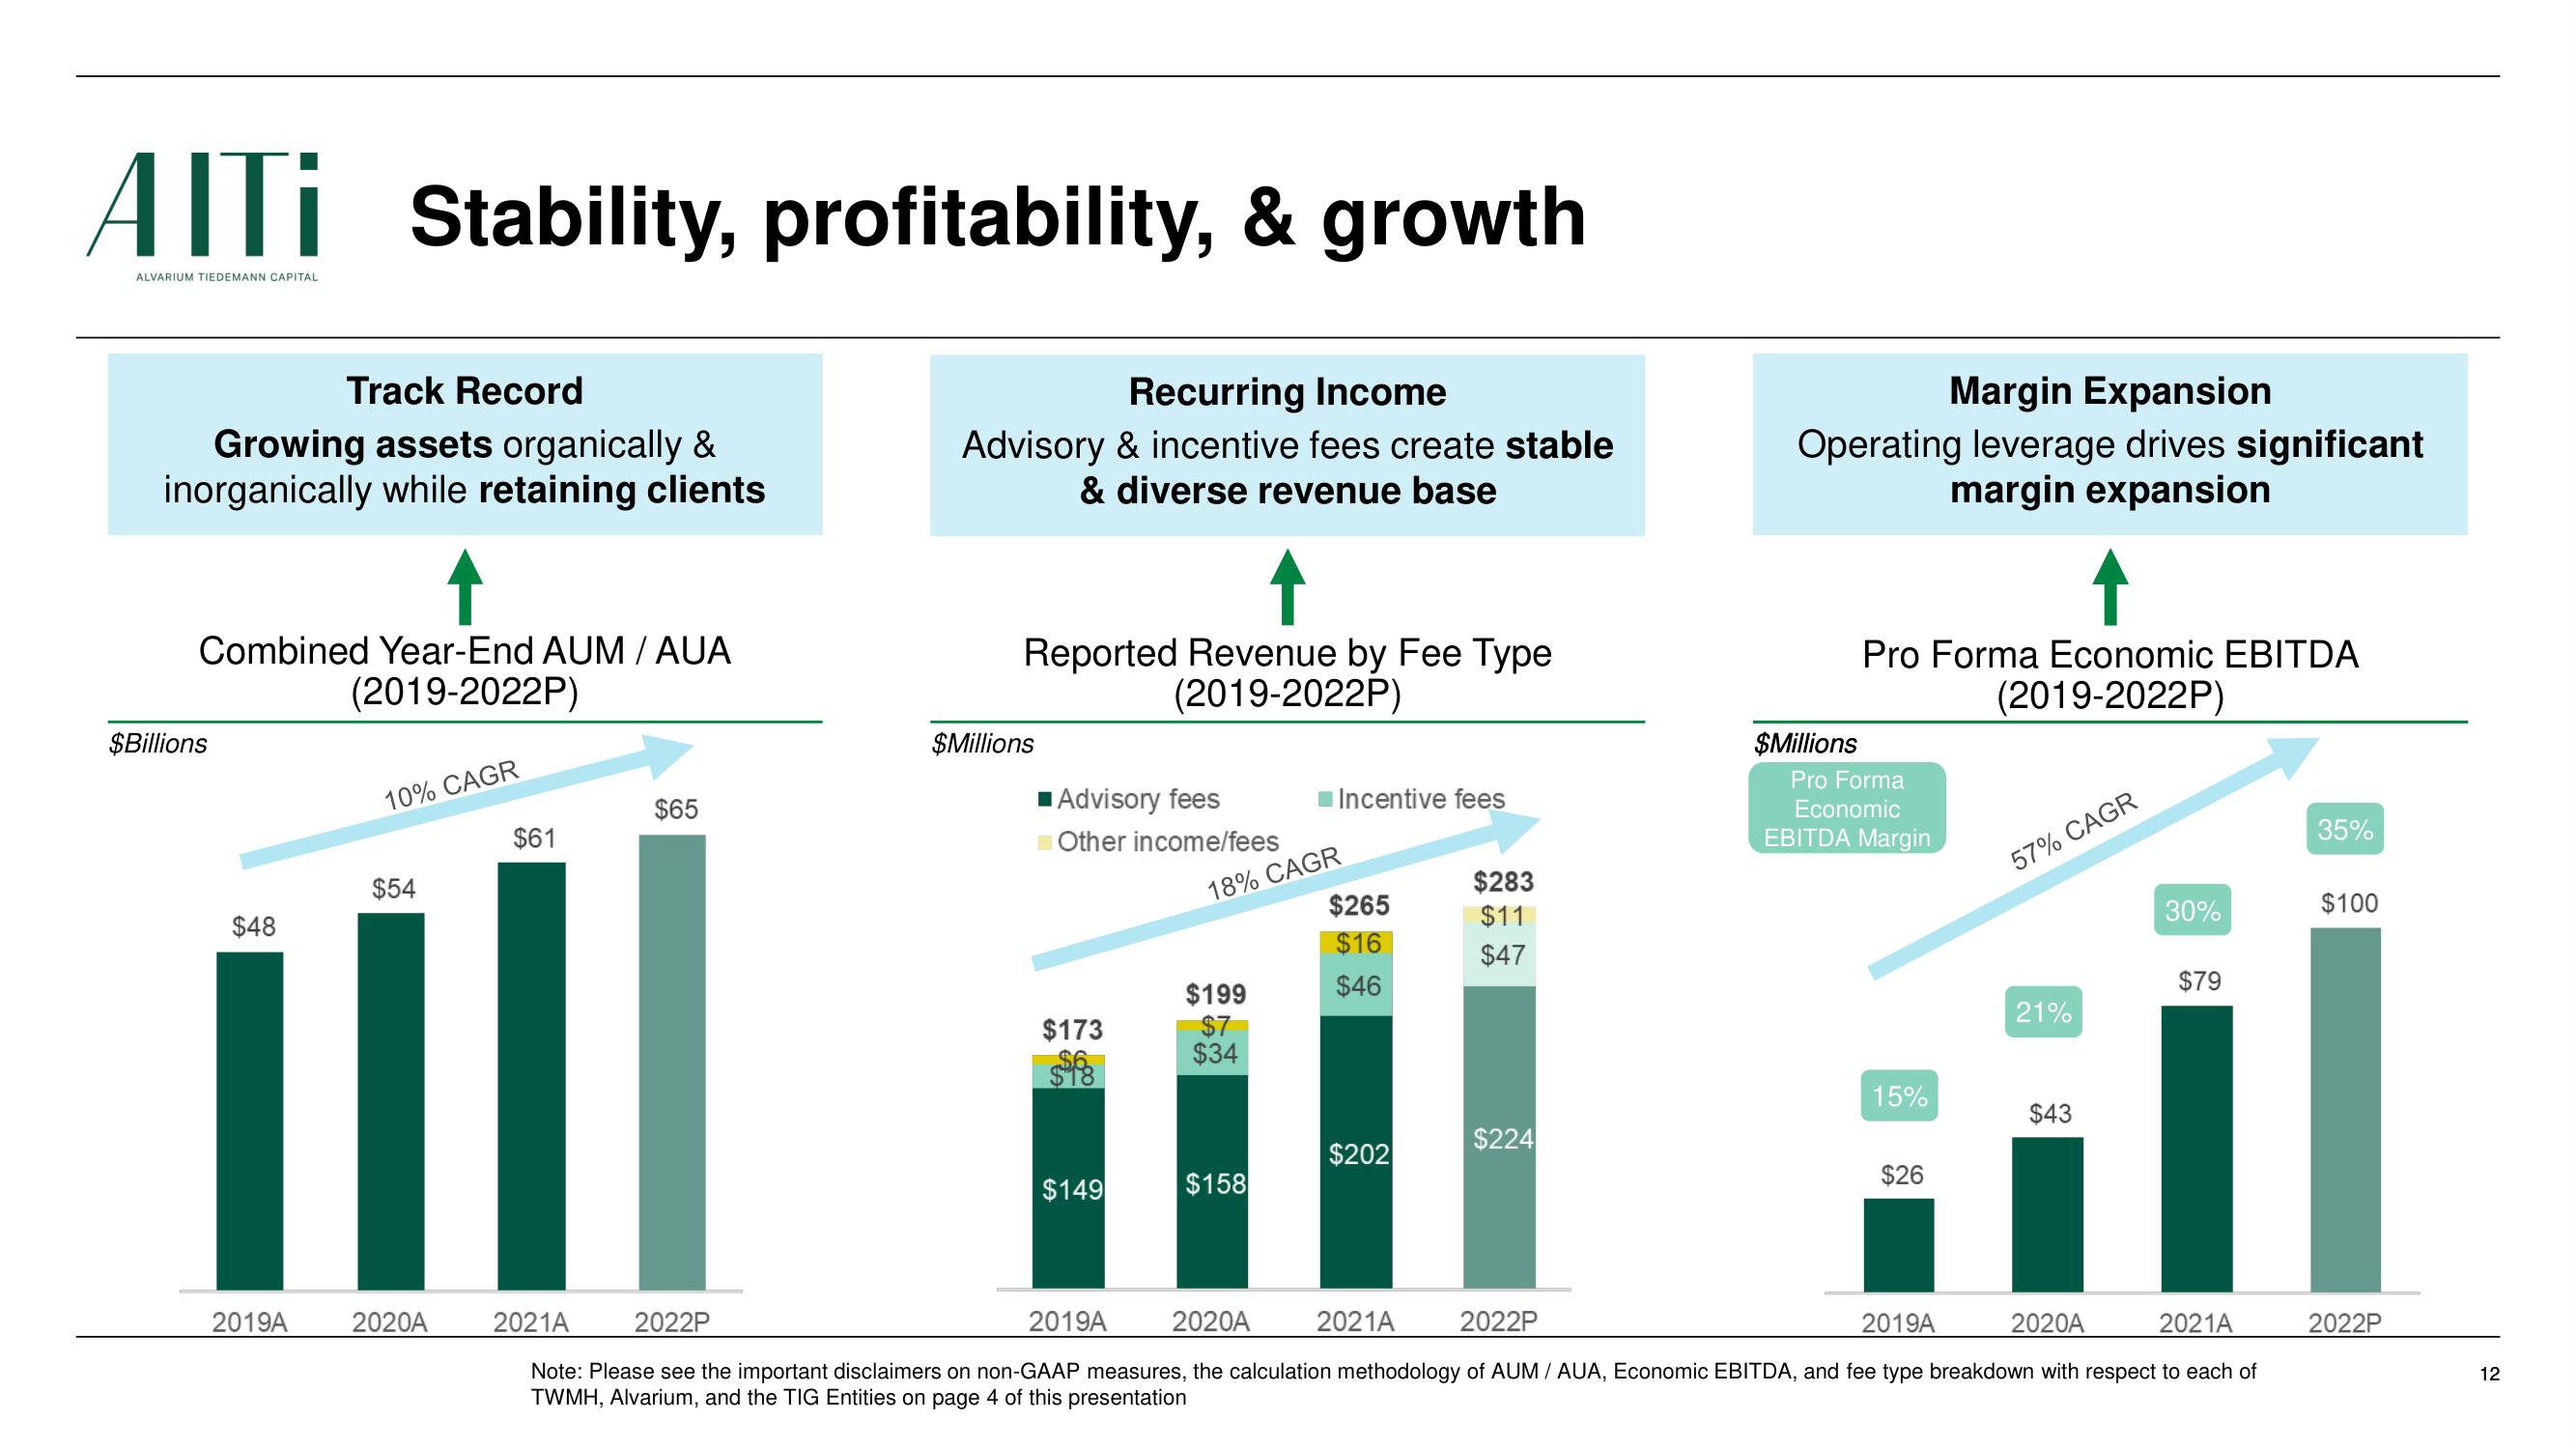
Track Record
Growing assets organically &
inorganically while retaining clients
Combined Year-End AUM / AUA
(2019-2022P)
$Billions
$48
2019A
10% CAGR
$54
2020A
$61
$65
Recurring Income
Advisory & incentive fees create stable
& diverse revenue base
Reported Revenue by Fee Type
(2019-2022P)
$Millions
Advisory fees
Other income/fees
$173
$$88
$149
2019A
18% CAGR
$199
$7
$34
Incentive fees
$158
$265
$16
$46
$202
2021A
$283
$11
$47
$224
Margin Expansion
Operating leverage drives significant
margin expansion
$Millions
Pro Forma Economic EBITDA
(2019-2022P)
Pro Forma
Economic
EBITDA Margin
15%
$26
57% CAGR
21%
$43
30%
$79
2020A
2022P
2019A
2020A
2021A
2021A 2022P
Note: Please see the important disclaimers on non-GAAP measures, the calculation methodology of AUM / AUA, Economic EBITDA, and fee type breakdown with respect to each of
TWMH, Alvarium, and the TIG Entities on page 4 of this presentation
35%
$100
2022P
12View entire presentation