Wirecard Results Presentation Deck
■
Transaction Volume
in EUR billion
90.2
9M 2018
Organic and M&A Related Growth
33.2%
organic
4.1
120.1
9M 2019
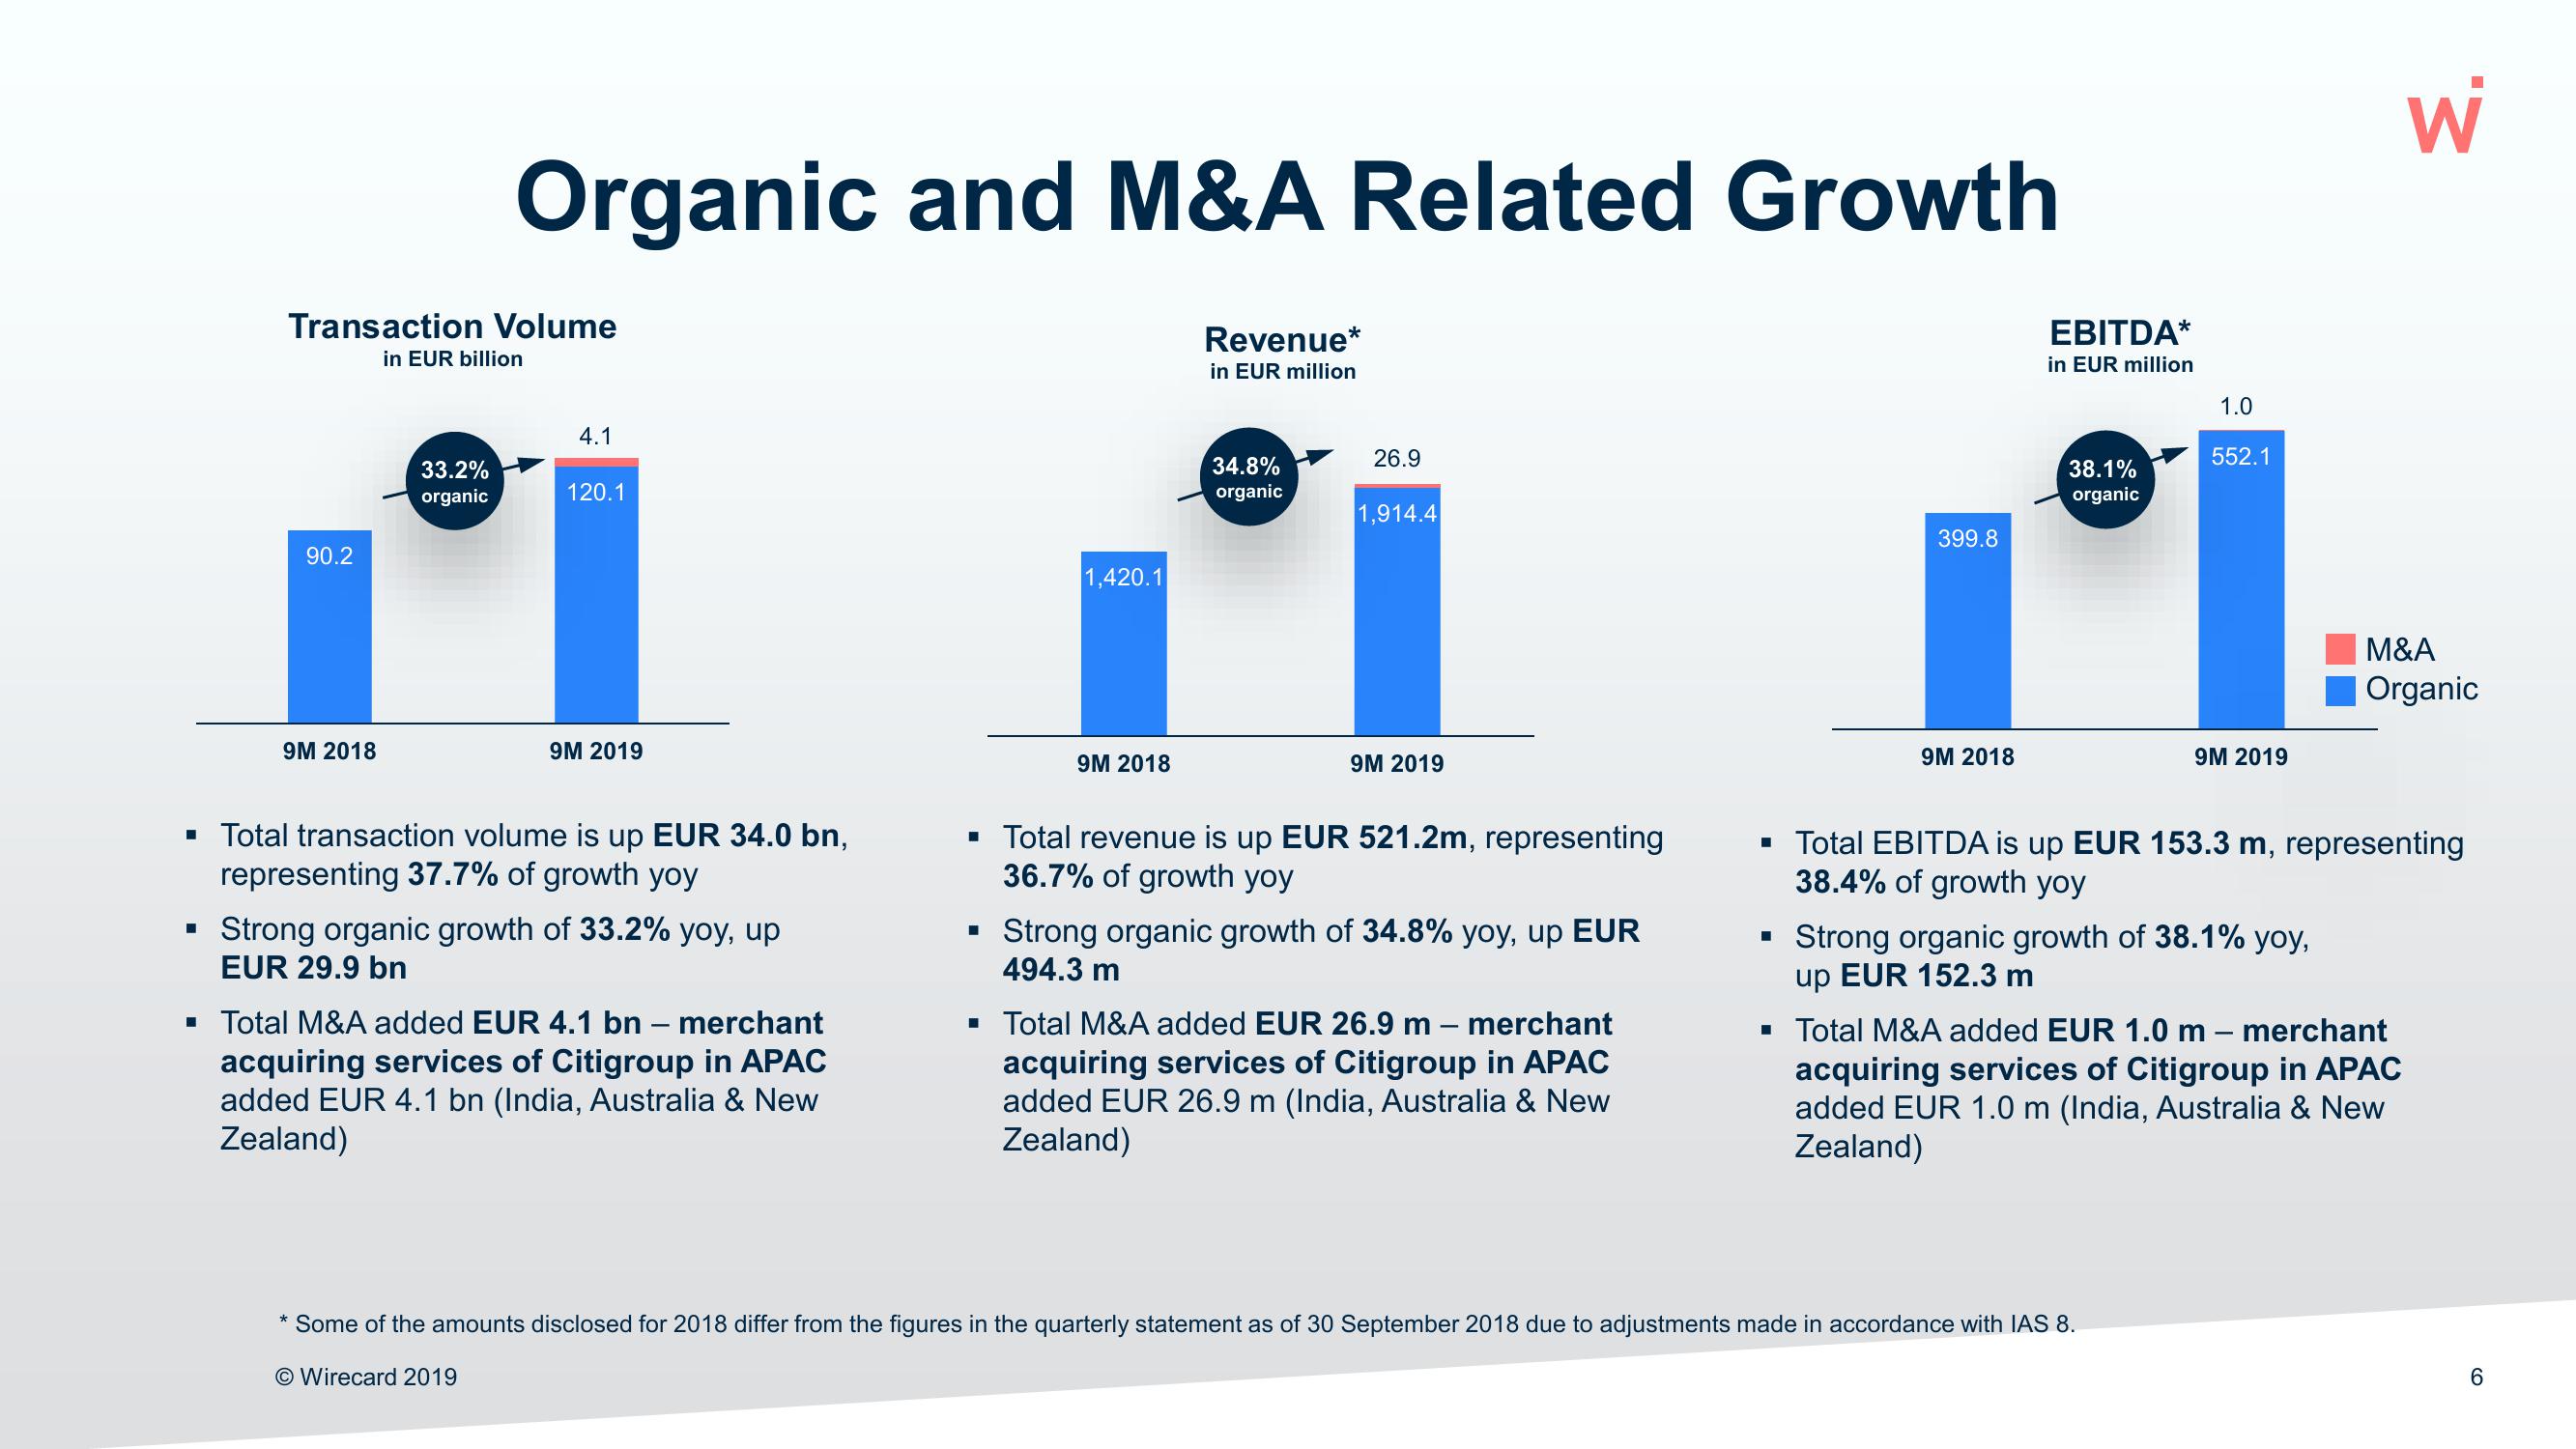
▪ Total transaction volume is up EUR 34.0 bn,
representing 37.7% of growth yoy
Strong organic growth of 33.2% yoy, up
EUR 29.9 bn
■ Total M&A added EUR 4.1 bn - merchant
acquiring services of Citigroup in APAC
added EUR 4.1 bn (India, Australia & New
Zealand)
1,420.1
■
9M 2018
Revenue*
in EUR million
34.8%
organic
26.9
1,914.4
9M 2019
▪ Total revenue is up EUR 521.2m, representing
36.7% of growth yoy
Strong organic growth of 34.8% yoy, up EUR
494.3 m
▪ Total M&A added EUR 26.9 m - merchant
acquiring services of Citigroup in APAC
added EUR 26.9 m (India, Australia & New
Zealand)
399.8
9M 2018
EBITDA*
in EUR million
38.1%
organic
1.0
552.1
9M 2019
* Some of the amounts disclosed for 2018 differ from the figures in the quarterly statement as of 30 September 2018 due to adjustments made in accordance with IAS 8.
O Wirecard 2019
Strong organic growth of 38.1% yoy,
up EUR 152.3 m
▪ Total EBITDA is up EUR 153.3 m, representing
38.4% of growth yoy
६.
M&A
Organic
■ Total M&A added EUR 1.0 m - merchant
acquiring services of Citigroup in APAC
added EUR 1.0 m (India, Australia & New
Zealand)
6View entire presentation