Summer 2023 Solar Industry Update
Solar Employees (000s)
U.S. Solar Workforce
(USEER)
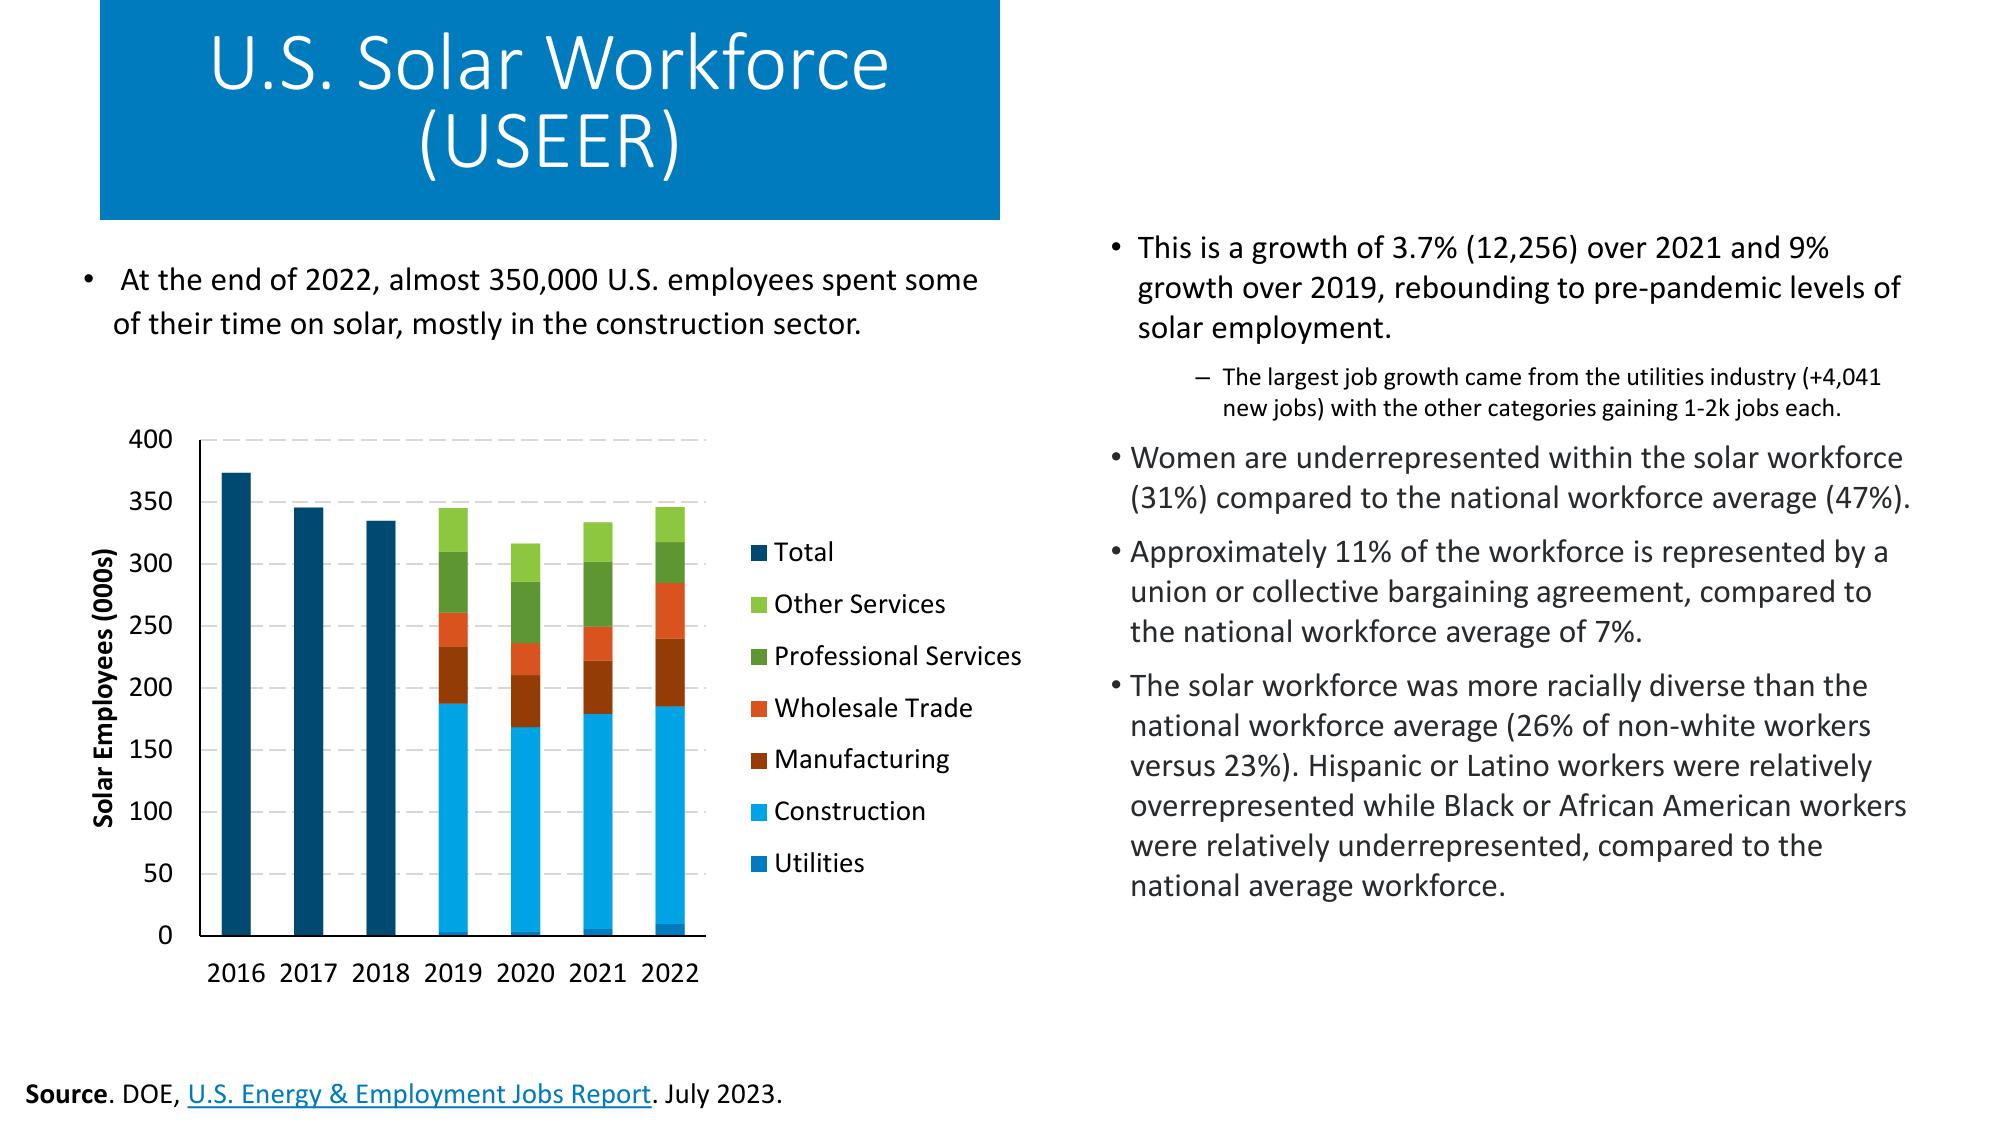
At the end of 2022, almost 350,000 U.S. employees spent some
of their time on solar, mostly in the construction sector.
400
350
300
250
200
150
100
50
Total
Other Services
Professional Services
Wholesale Trade
Manufacturing
Construction
Utilities
•
This is a growth of 3.7% (12,256) over 2021 and 9%
growth over 2019, rebounding to pre-pandemic levels of
solar employment.
The largest job growth came from the utilities industry (+4,041
new jobs) with the other categories gaining 1-2k jobs each.
• Women are underrepresented within the solar workforce
(31%) compared to the national workforce average (47%).
• Approximately 11% of the workforce is represented by a
union or collective bargaining agreement, compared to
the national workforce average of 7%.
• The solar workforce was more racially diverse than the
national workforce average (26% of non-white workers
versus 23%). Hispanic or Latino workers were relatively
overrepresented while Black or African American workers
were relatively underrepresented, compared to the
national average workforce.
0
2016 2017 2018 2019 2020 2021 2022
Source. DOE, U.S. Energy & Employment Jobs Report. July 2023.View entire presentation