Kinnevik Results Presentation Deck
Intro
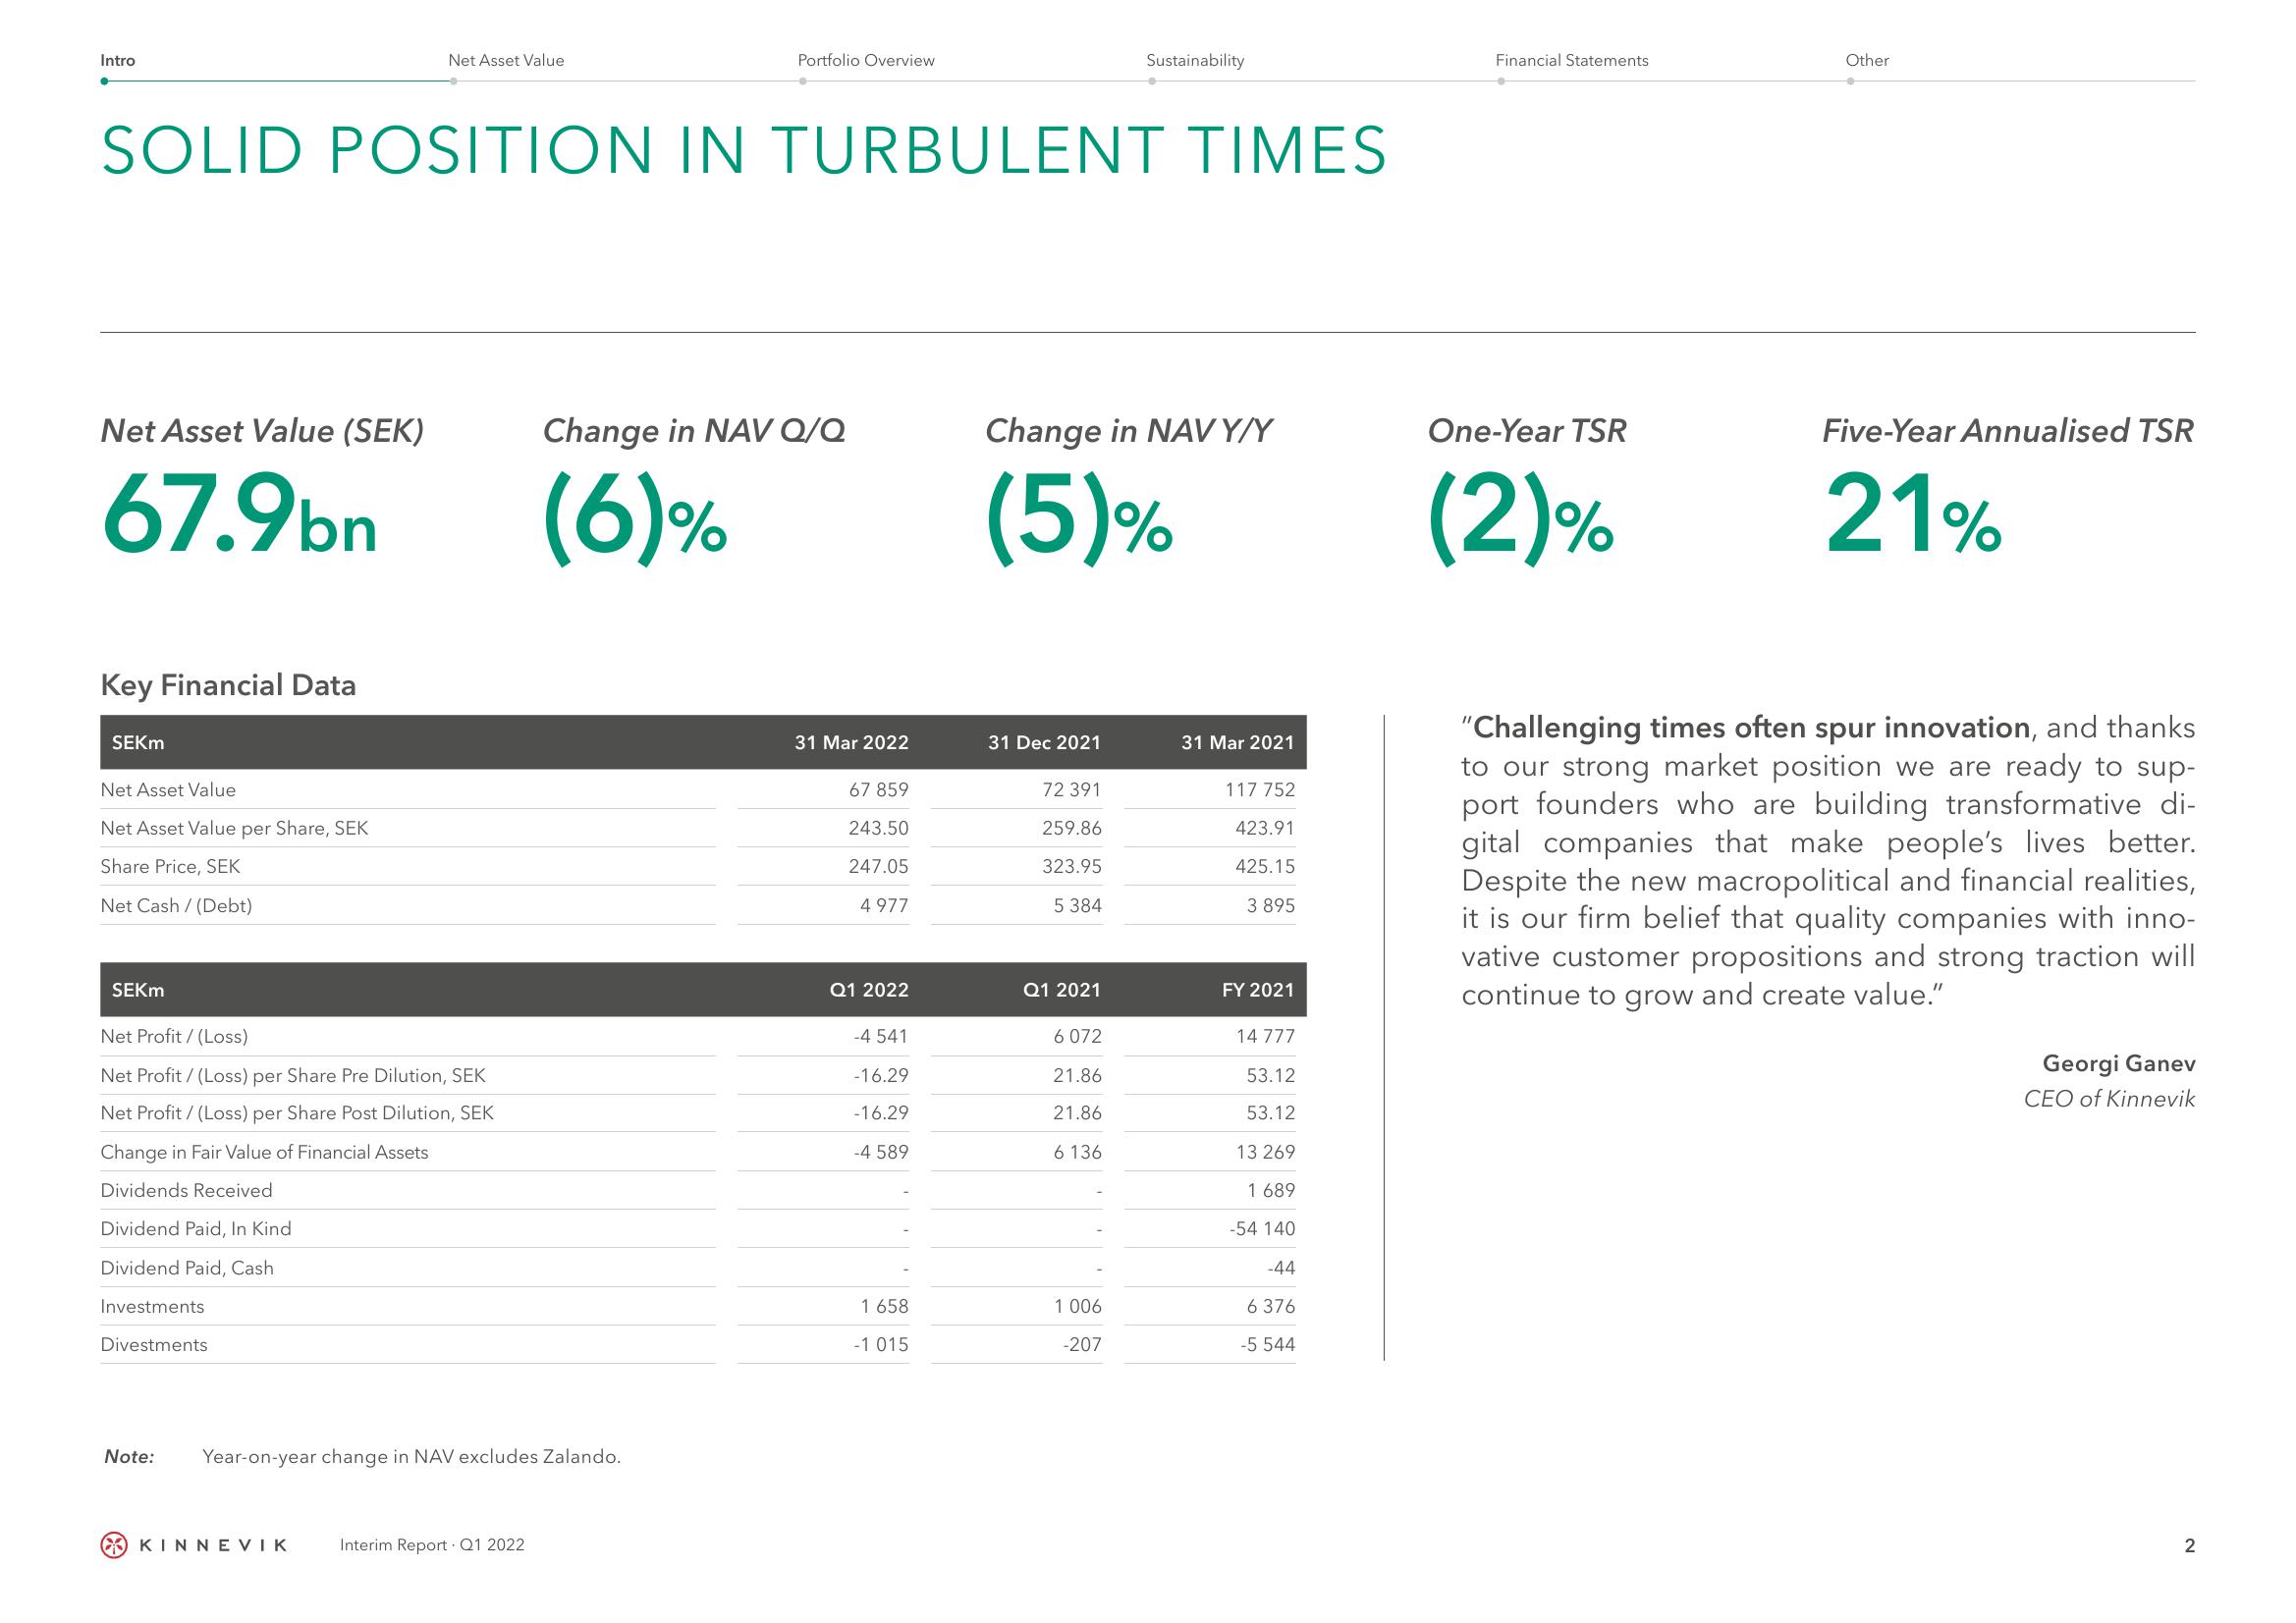
Net Asset Value (SEK)
67.9bn
Key Financial Data
SOLID POSITION IN TURBULENT TIMES
SEKM
Net Asset Value
Net Asset Value per Share, SEK
Share Price, SEK
Net Cash/ (Debt)
SEKM
Net Asset Value
Net Profit/(Loss)
Net Profit / (Loss) per Share Pre Dilution, SEK
Net Profit / (Loss) per Share Post Dilution, SEK
Change in Fair Value of Financial Assets
Dividends Received
Dividend Paid, In Kind
Dividend Paid, Cash
Investments
Divestments
Note:
Portfolio Overview
Year-on-year change in NAV excludes Zalando.
Ο ΚΙΝΝEVIK Interim Report Q1 2022
Change in NAV Q/Q
(6)%
31 Mar 2022
67 859
243.50
247.05
4 977
Q1 2022
-4541
-16.29
-16.29
-4 589
1 658
-1 015
Change in NAVY/Y
(5)%
31 Dec 2021
72 391
259.86
323.95
5 384
Q1 2021
Sustainability
6 072
21.86
21.86
6 136
1 006
-207
31 Mar 2021
117 752
423.91
425.15
3 895
FY 2021
14 777
53.12
53.12
13 269
1 689
-54 140
-44
6 376
-5 544
Financial Statements
One-Year TSR
(2)%
Other
Five-Year Annualised TSR
21%
"Challenging times often spur innovation, and thanks
to our strong market position we are ready to sup-
port founders who are building transformative di-
gital companies that make people's lives better.
Despite the new macropolitical and financial realities,
it is our firm belief that quality companies with inno-
vative customer propositions and strong traction will
continue to grow and create value."
Georgi Ganev
CEO of Kinnevik
2View entire presentation