Investor Presentation
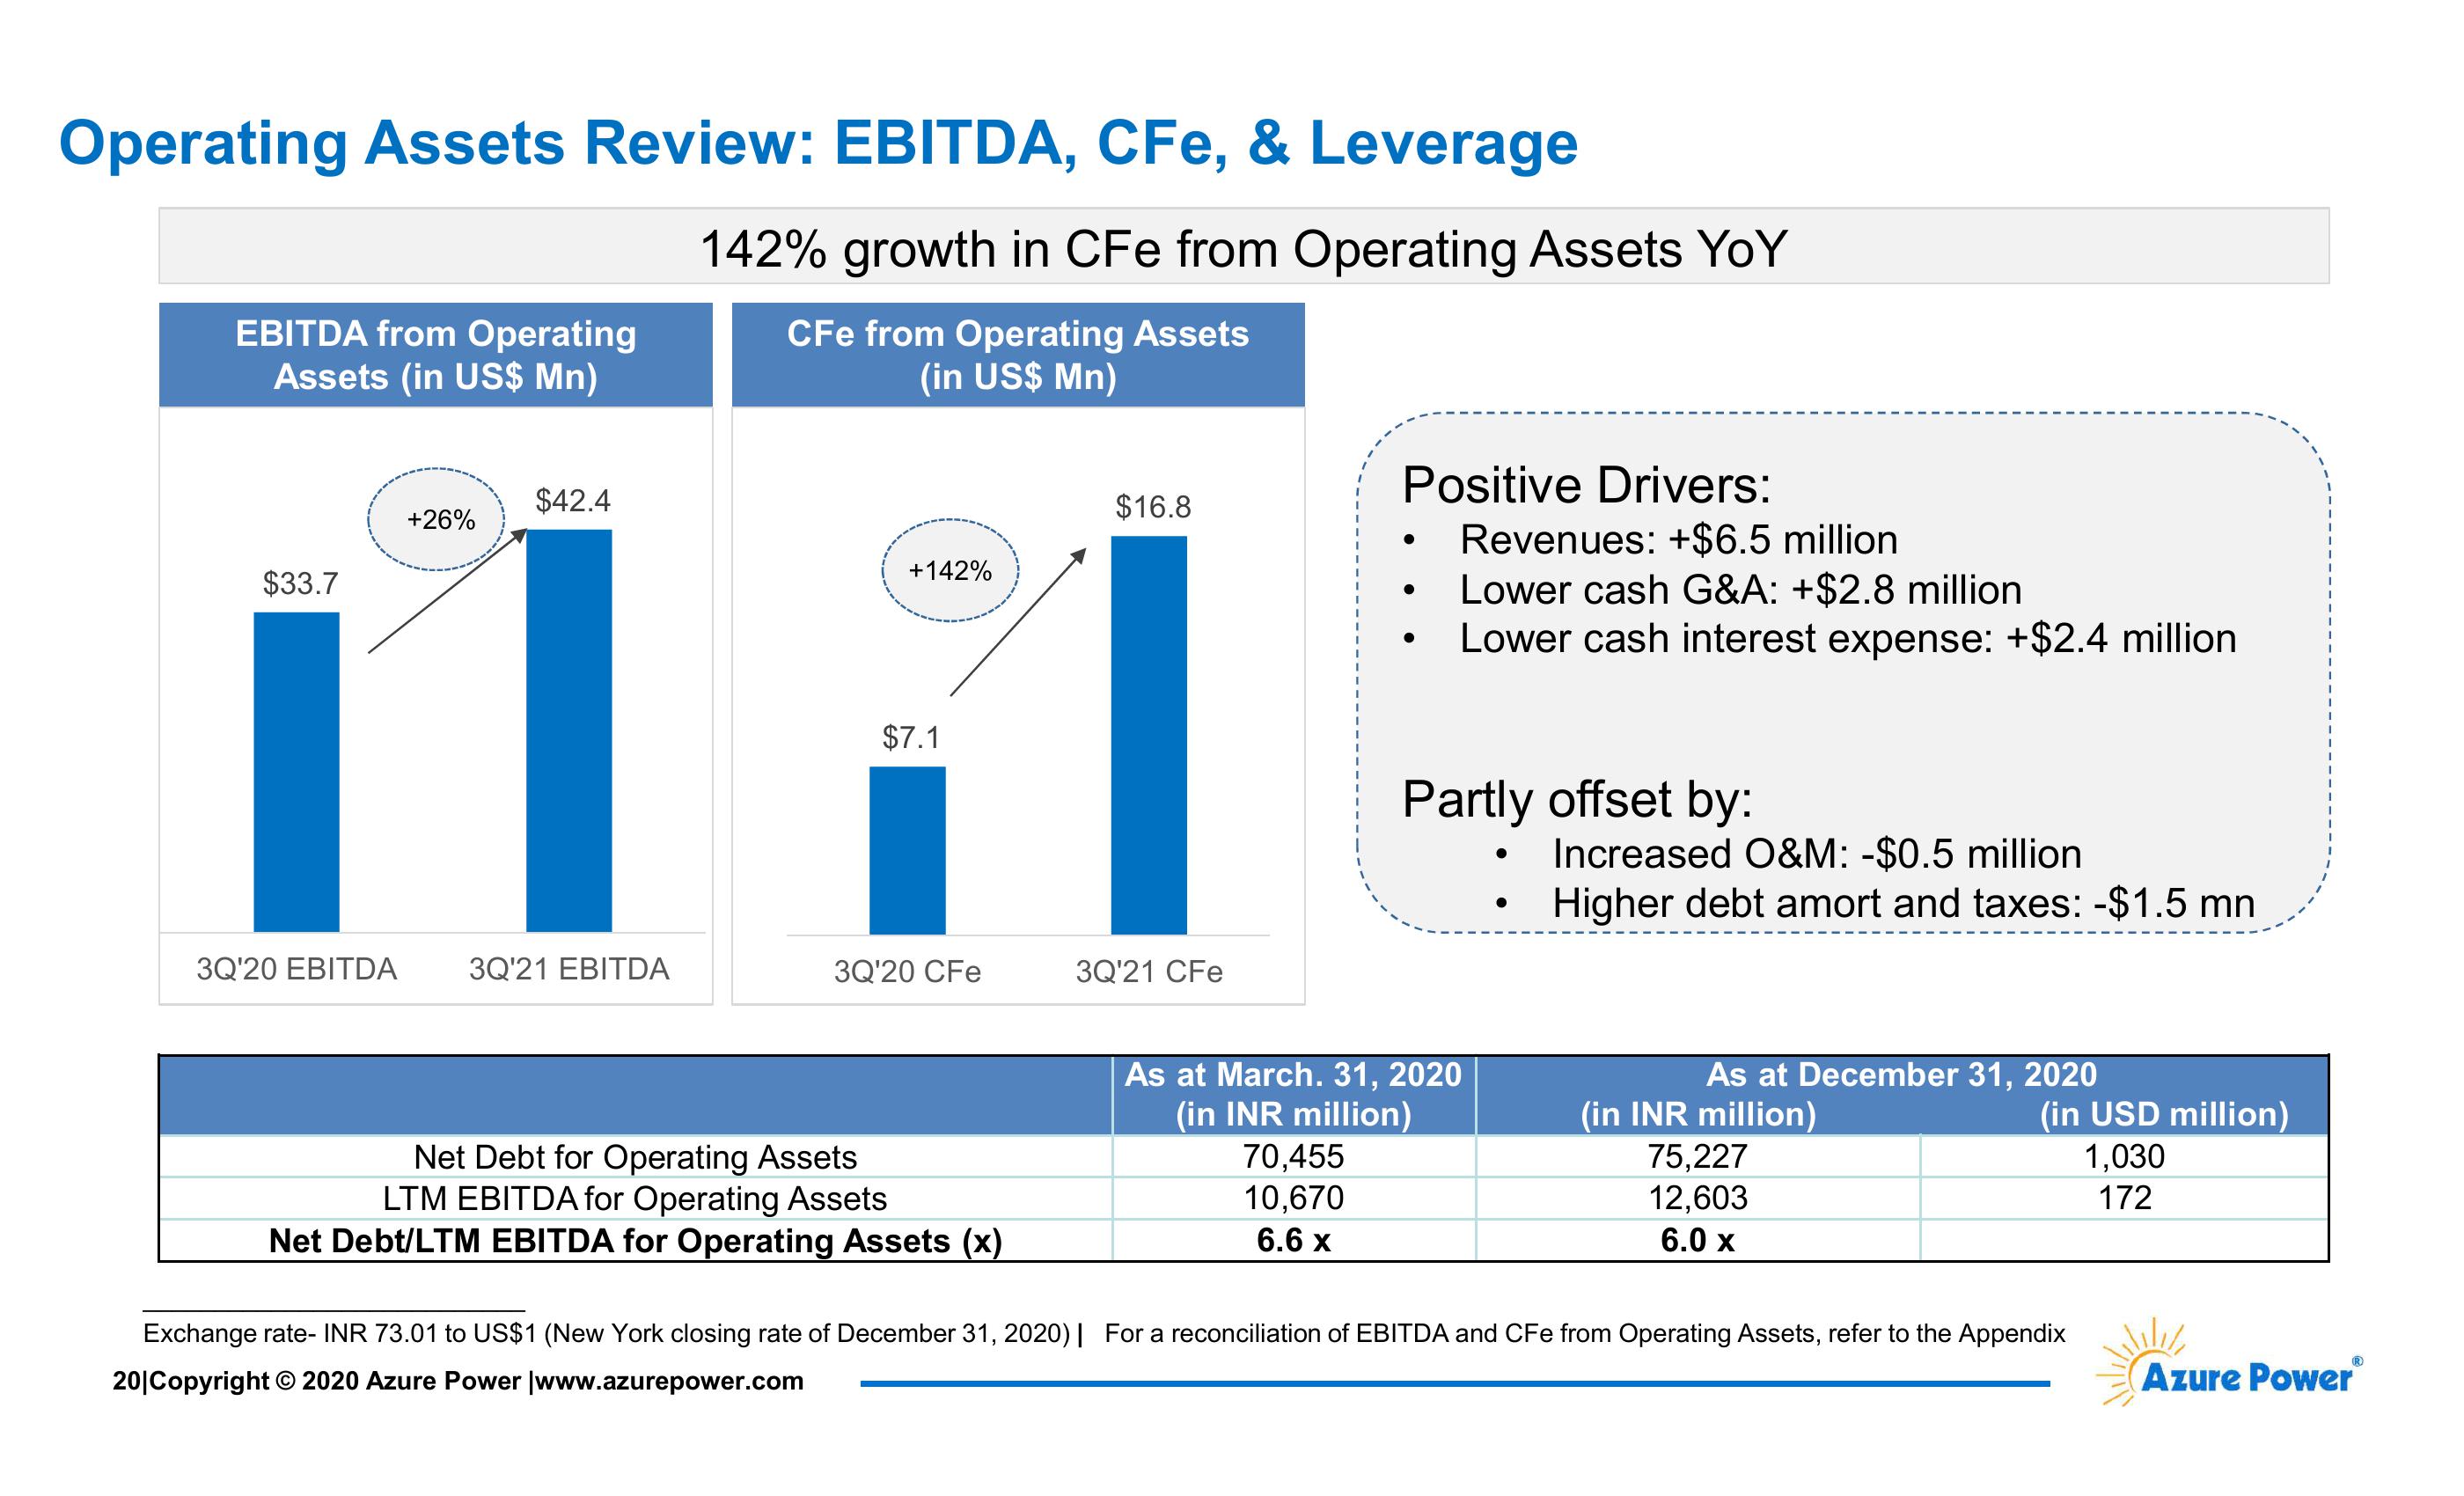
Operating Assets Review: EBITDA, CFe, & Leverage
EBITDA from Operating
Assets (in US$ Mn)
142% growth in CFe from Operating Assets YoY
CFe from Operating Assets
(in US$ Mn)
$42.4
$16.8
+26%
•
+142%
$33.7
$7.1
3Q'20 EBITDA
3Q'21 EBITDA
3Q'20 CFe
3Q'21 CFe
Positive Drivers:
•
Revenues: +$6.5 million
Lower cash G&A: +$2.8 million
Lower cash interest expense: +$2.4 million
Partly offset by:
•
Increased O&M: -$0.5 million
.
Higher debt amort and taxes: -$1.5 mn
Net Debt for Operating Assets
LTM EBITDA for Operating Assets
Net Debt/LTM EBITDA for Operating Assets (x)
As at March. 31, 2020
(in INR million)
70,455
10,670
6.6 x
As at December 31, 2020
(in INR million)
75,227
12,603
6.0 x
(in USD million)
1,030
Exchange rate- INR 73.01 to US$1 (New York closing rate of December 31, 2020) | For a reconciliation of EBITDA and CFe from Operating Assets, refer to the Appendix
20|Copyright © 2020 Azure Power |www.azurepower.com
172
Azure PowerⓇ
®View entire presentation