SoftBank Results Presentation Deck
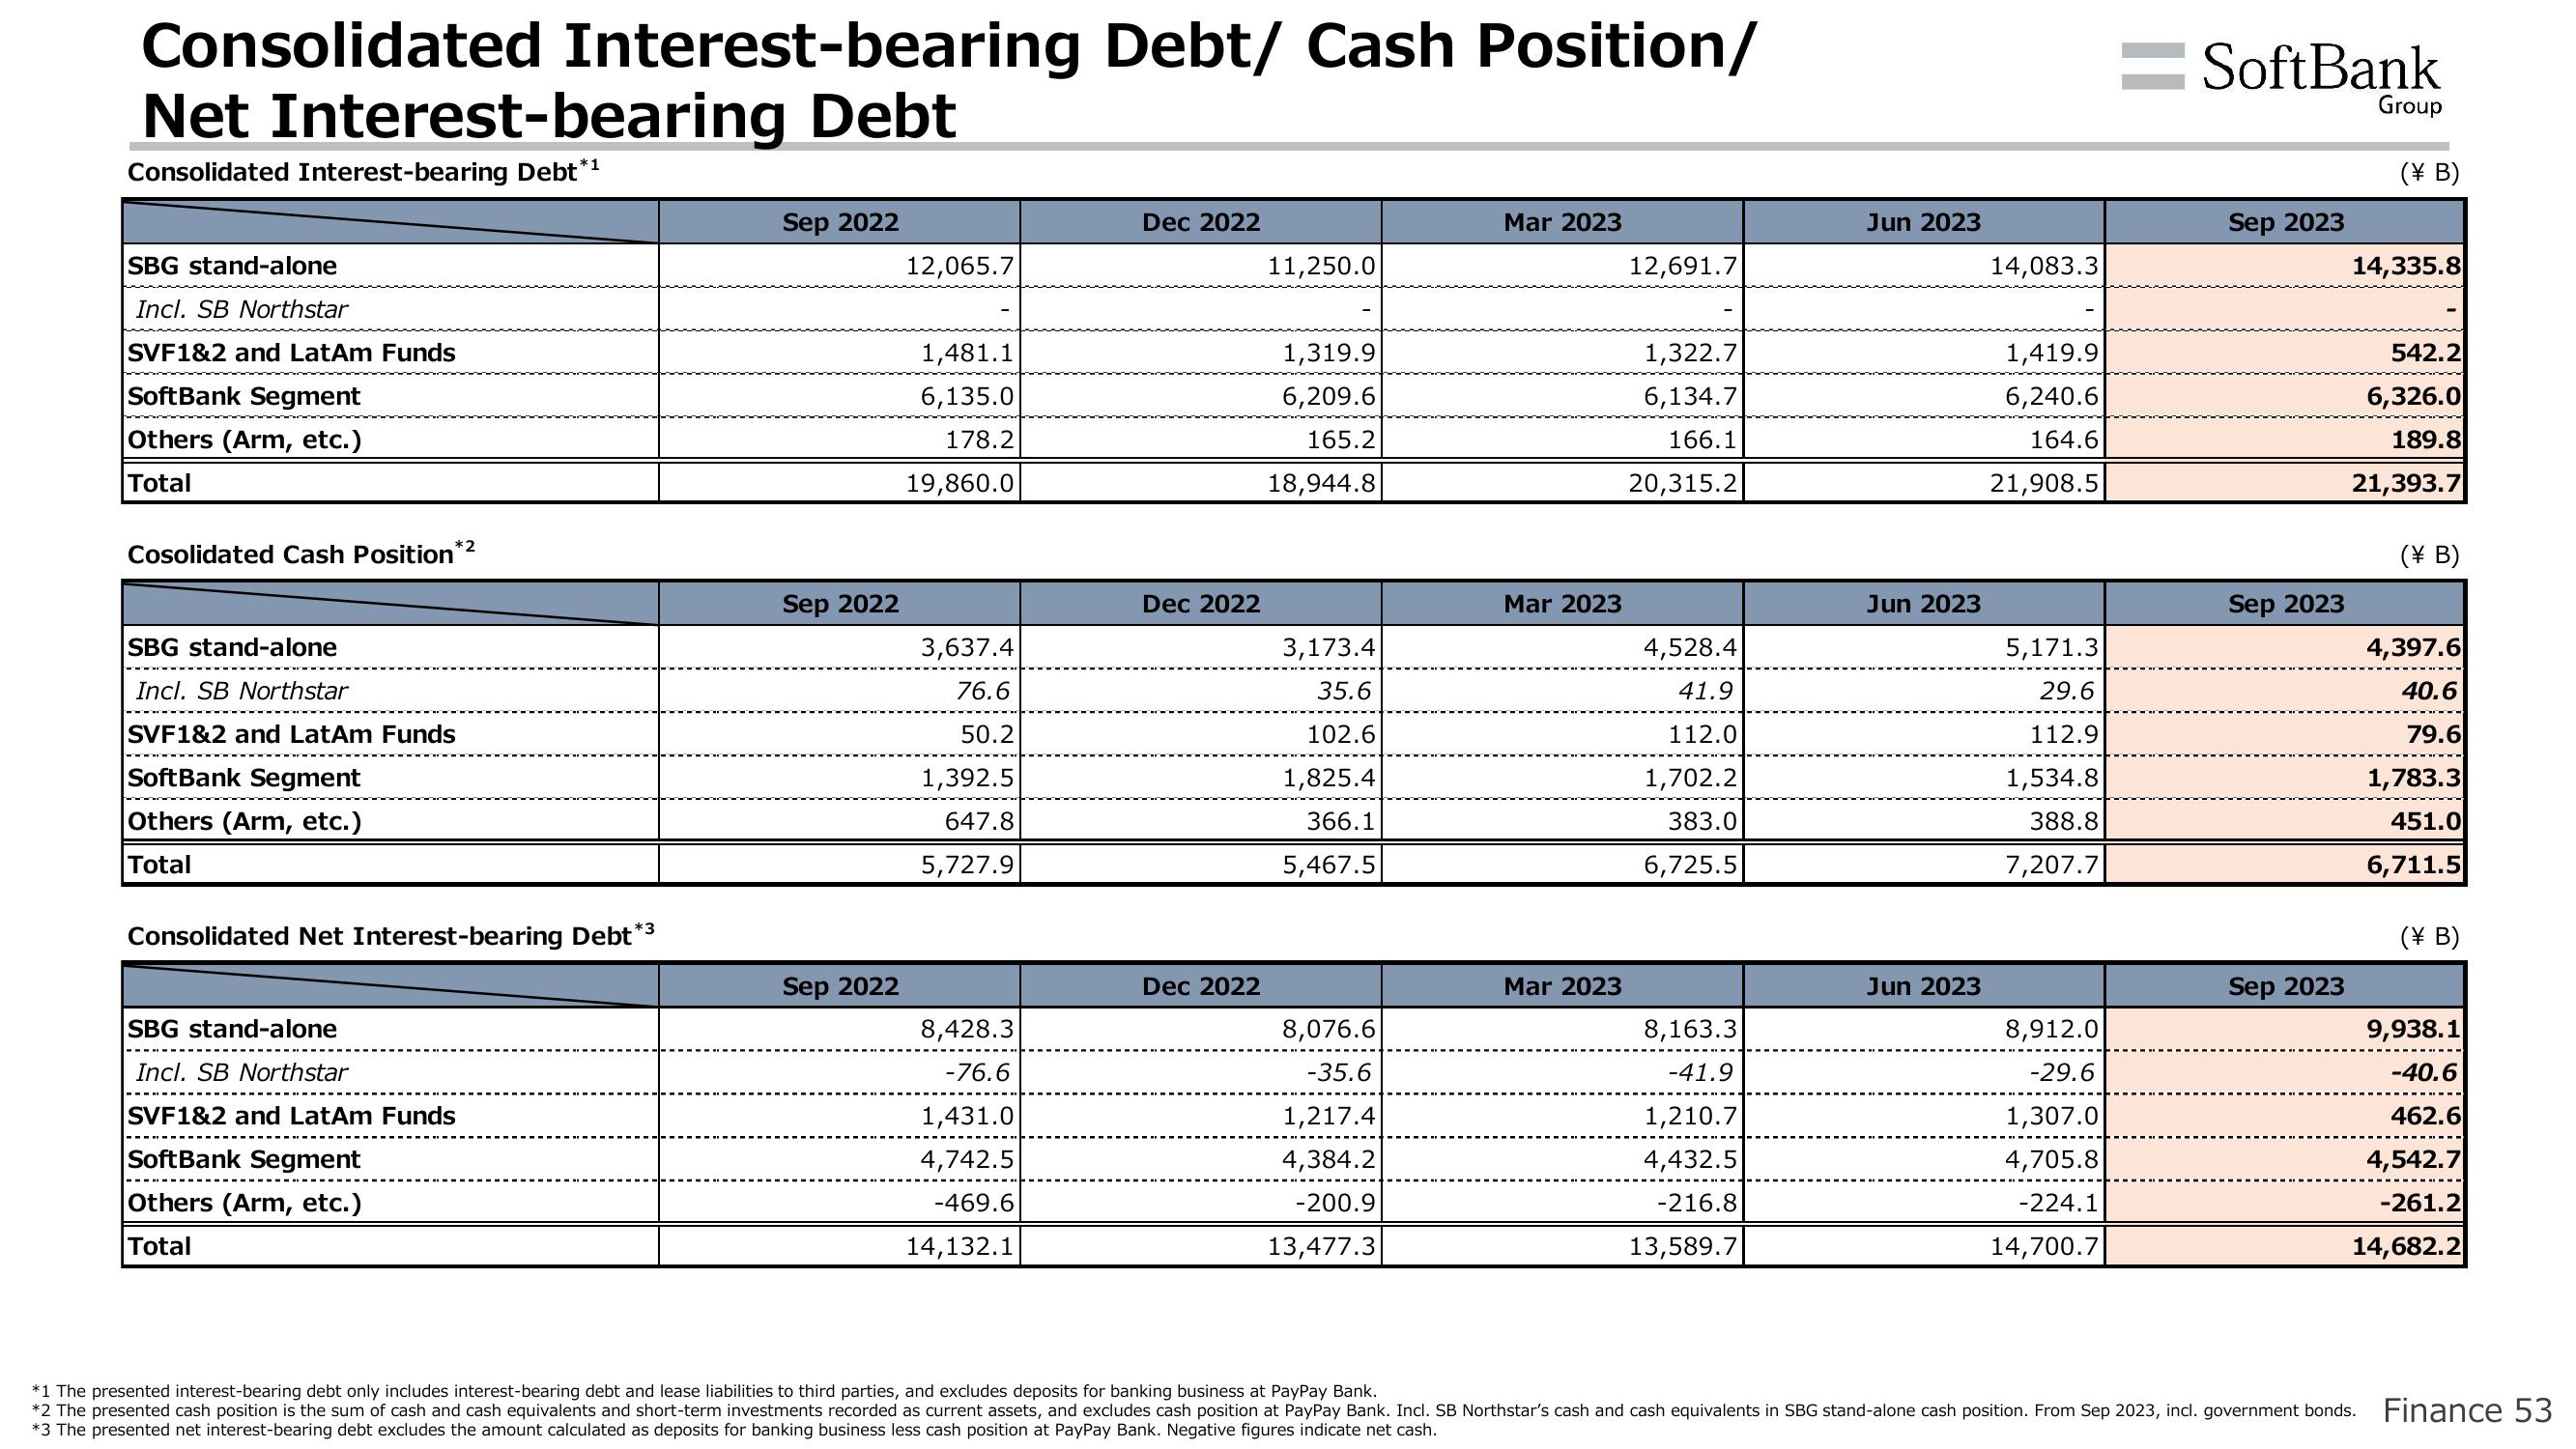
Consolidated Interest-bearing Debt/ Cash Position/
Net Interest-bearing Debt
Consolidated Interest-bearing Debt*¹
SBG stand-alone
Incl. SB Northstar
SVF1&2 and LatAm Funds
SoftBank Segment
Others (Arm, etc.)
Total
*2
Cosolidated Cash Position*
SBG stand-alone
Incl. SB Northstar
SVF1&2 and LatAm Funds
SoftBank Segment
Others (Arm, etc.)
Total
Consolidated Net Interest-bearing Debt*³
SBG stand-alone
Incl. SB Northstar
SVF1&2 and LatAm Funds
SoftBank Segment
Others (Arm, etc.)
Total
Sep 2022
Sep 2022
Sep 2022
12,065.7
1,481.1
6,135.0
178.2
19,860.0
3,637.4
76.6
50.2
1,392.5
647.8
5,727.9
8,428.3
-76.6
1,431.0
4,742.5
-469.6
14,132.1
Dec 2022
Dec 2022
Dec 2022
11,250.0
1,319.9
6,209.6
165.2
18,944.8
3,173.4
35.6
102.6
1,825.4
366.1
5,467.5
8,076.6
-35.6
1,217.4
4,384.2
-200.9
13,477.3
Mar 2023
Mar 2023
Mar 2023
12,691.7
1,322.7
6,134.7
166.1
20,315.2
4,528.4
41.9
112.0
1,702.2
383.0
6,725.5
8,163.3
-41.9
1,210.7
4,432.5
-216.8
13,589.7
Jun 2023
Jun 2023
Jun 2023
14,083.3
1,419.9
6,240.6
164.6
21,908.5
5,171.3
29.6
112.9
1,534.8
388.8
7,207.7
8,912.0
-29.6
1,307.0
4,705.8
-224.1
14,700.7
SoftBank
Sep 2023
Sep 2023
Sep 2023
Group
(\B)
14,335.8
542.2
6,326.0
189.8
21,393.7
(¥ B)
4,397.6
40.6
79.6
1,783.3
451.0
6,711.5
(\ B)
9,938.1
-40.6
462.6
4,542.7
-261.2
14,682.2
*1 The presented interest-bearing debt only includes interest-bearing debt and lease liabilities to third parties, and excludes deposits for banking business at PayPay Bank.
*2 The presented cash position is the sum of cash and cash equivalents and short-term investments recorded as current assets, and excludes cash position at PayPay Bank. Incl. SB Northstar's cash and cash equivalents in SBG stand-alone cash position. From Sep 2023, incl. government bonds. Finance 53
*3 The presented net interest-bearing debt excludes the amount calculated as deposits for banking business less cash position at PayPay Bank. Negative figures indicate net cash.View entire presentation