Lanvin Results Presentation Deck
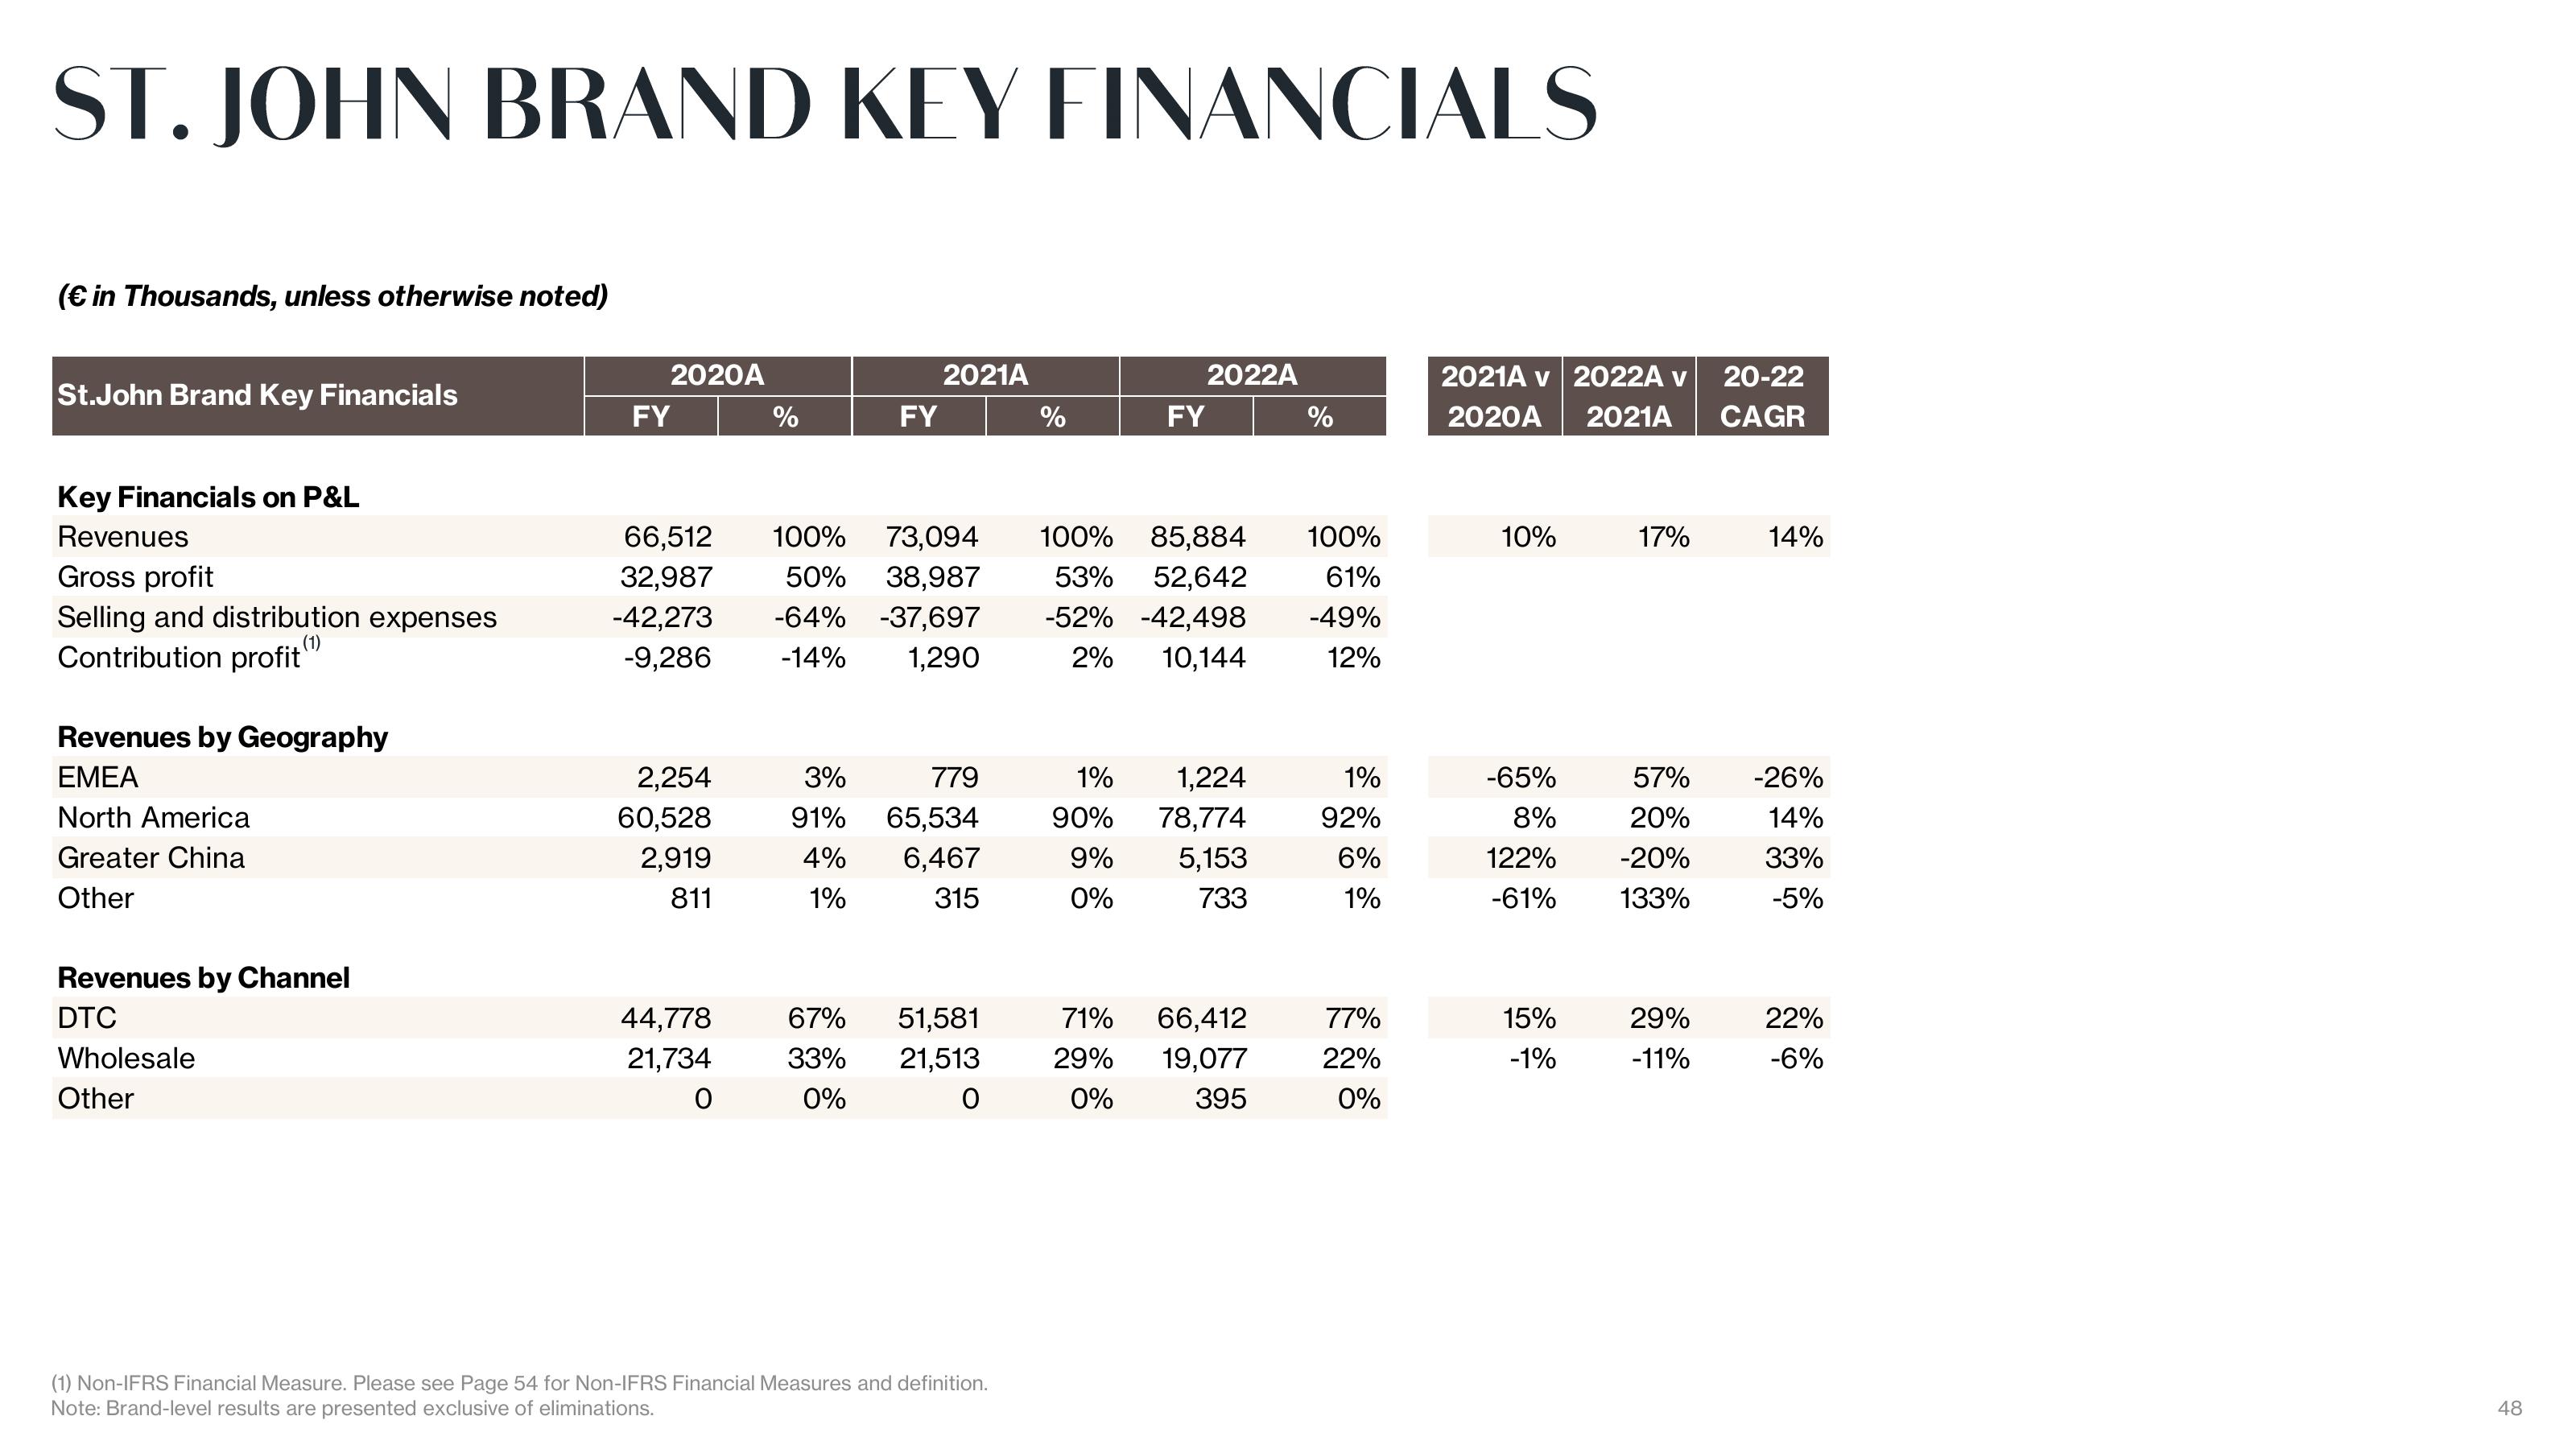
ST. JOHN BRAND KEY FINANCIALS
(€ in Thousands, unless otherwise noted)
St.John Brand Key Financials
Key Financials on P&L
Revenues
Gross profit
Selling and distribution expenses
(1)
Contribution profit
Revenues by Geography
EMEA
North America
Greater China
Other
Revenues by Channel
DTC
Wholesale
Other
2020A
FY
2,254
60,528
2,919
811
%
44,778
21,734
0
FY
66,512 100% 73,094
32,987 50% 38,987
-42,273 -64% -37,697
-9,286 -14% 1,290
2021A
3%
779
91% 65,534
6,467
315
4%
1%
67% 51,581
33% 21,513
0%
O
(1) Non-IFRS Financial Measure. Please see Page 54 for Non-IFRS Financial Measures and definition.
Note: Brand-level results are presented exclusive of eliminations.
%
2022A
1%
90%
9%
0%
FY
100% 85,884 100%
53% 52,642 61%
-52% -42,498 -49%
2% 10,144
12%
1,224
78,774
5,153
733
%
71% 66,412
29%
19,077
0%
395
1%
92%
6%
1%
77%
22%
0%
2021A v 2022A v
2020A 2021A
10%
-65%
8%
122%
-61%
15%
-1%
17%
57%
20%
-20%
133%
29%
-11%
20-22
CAGR
14%
-26%
14%
33%
-5%
22%
-6%
48View entire presentation