Paycor Investor Presentation Deck
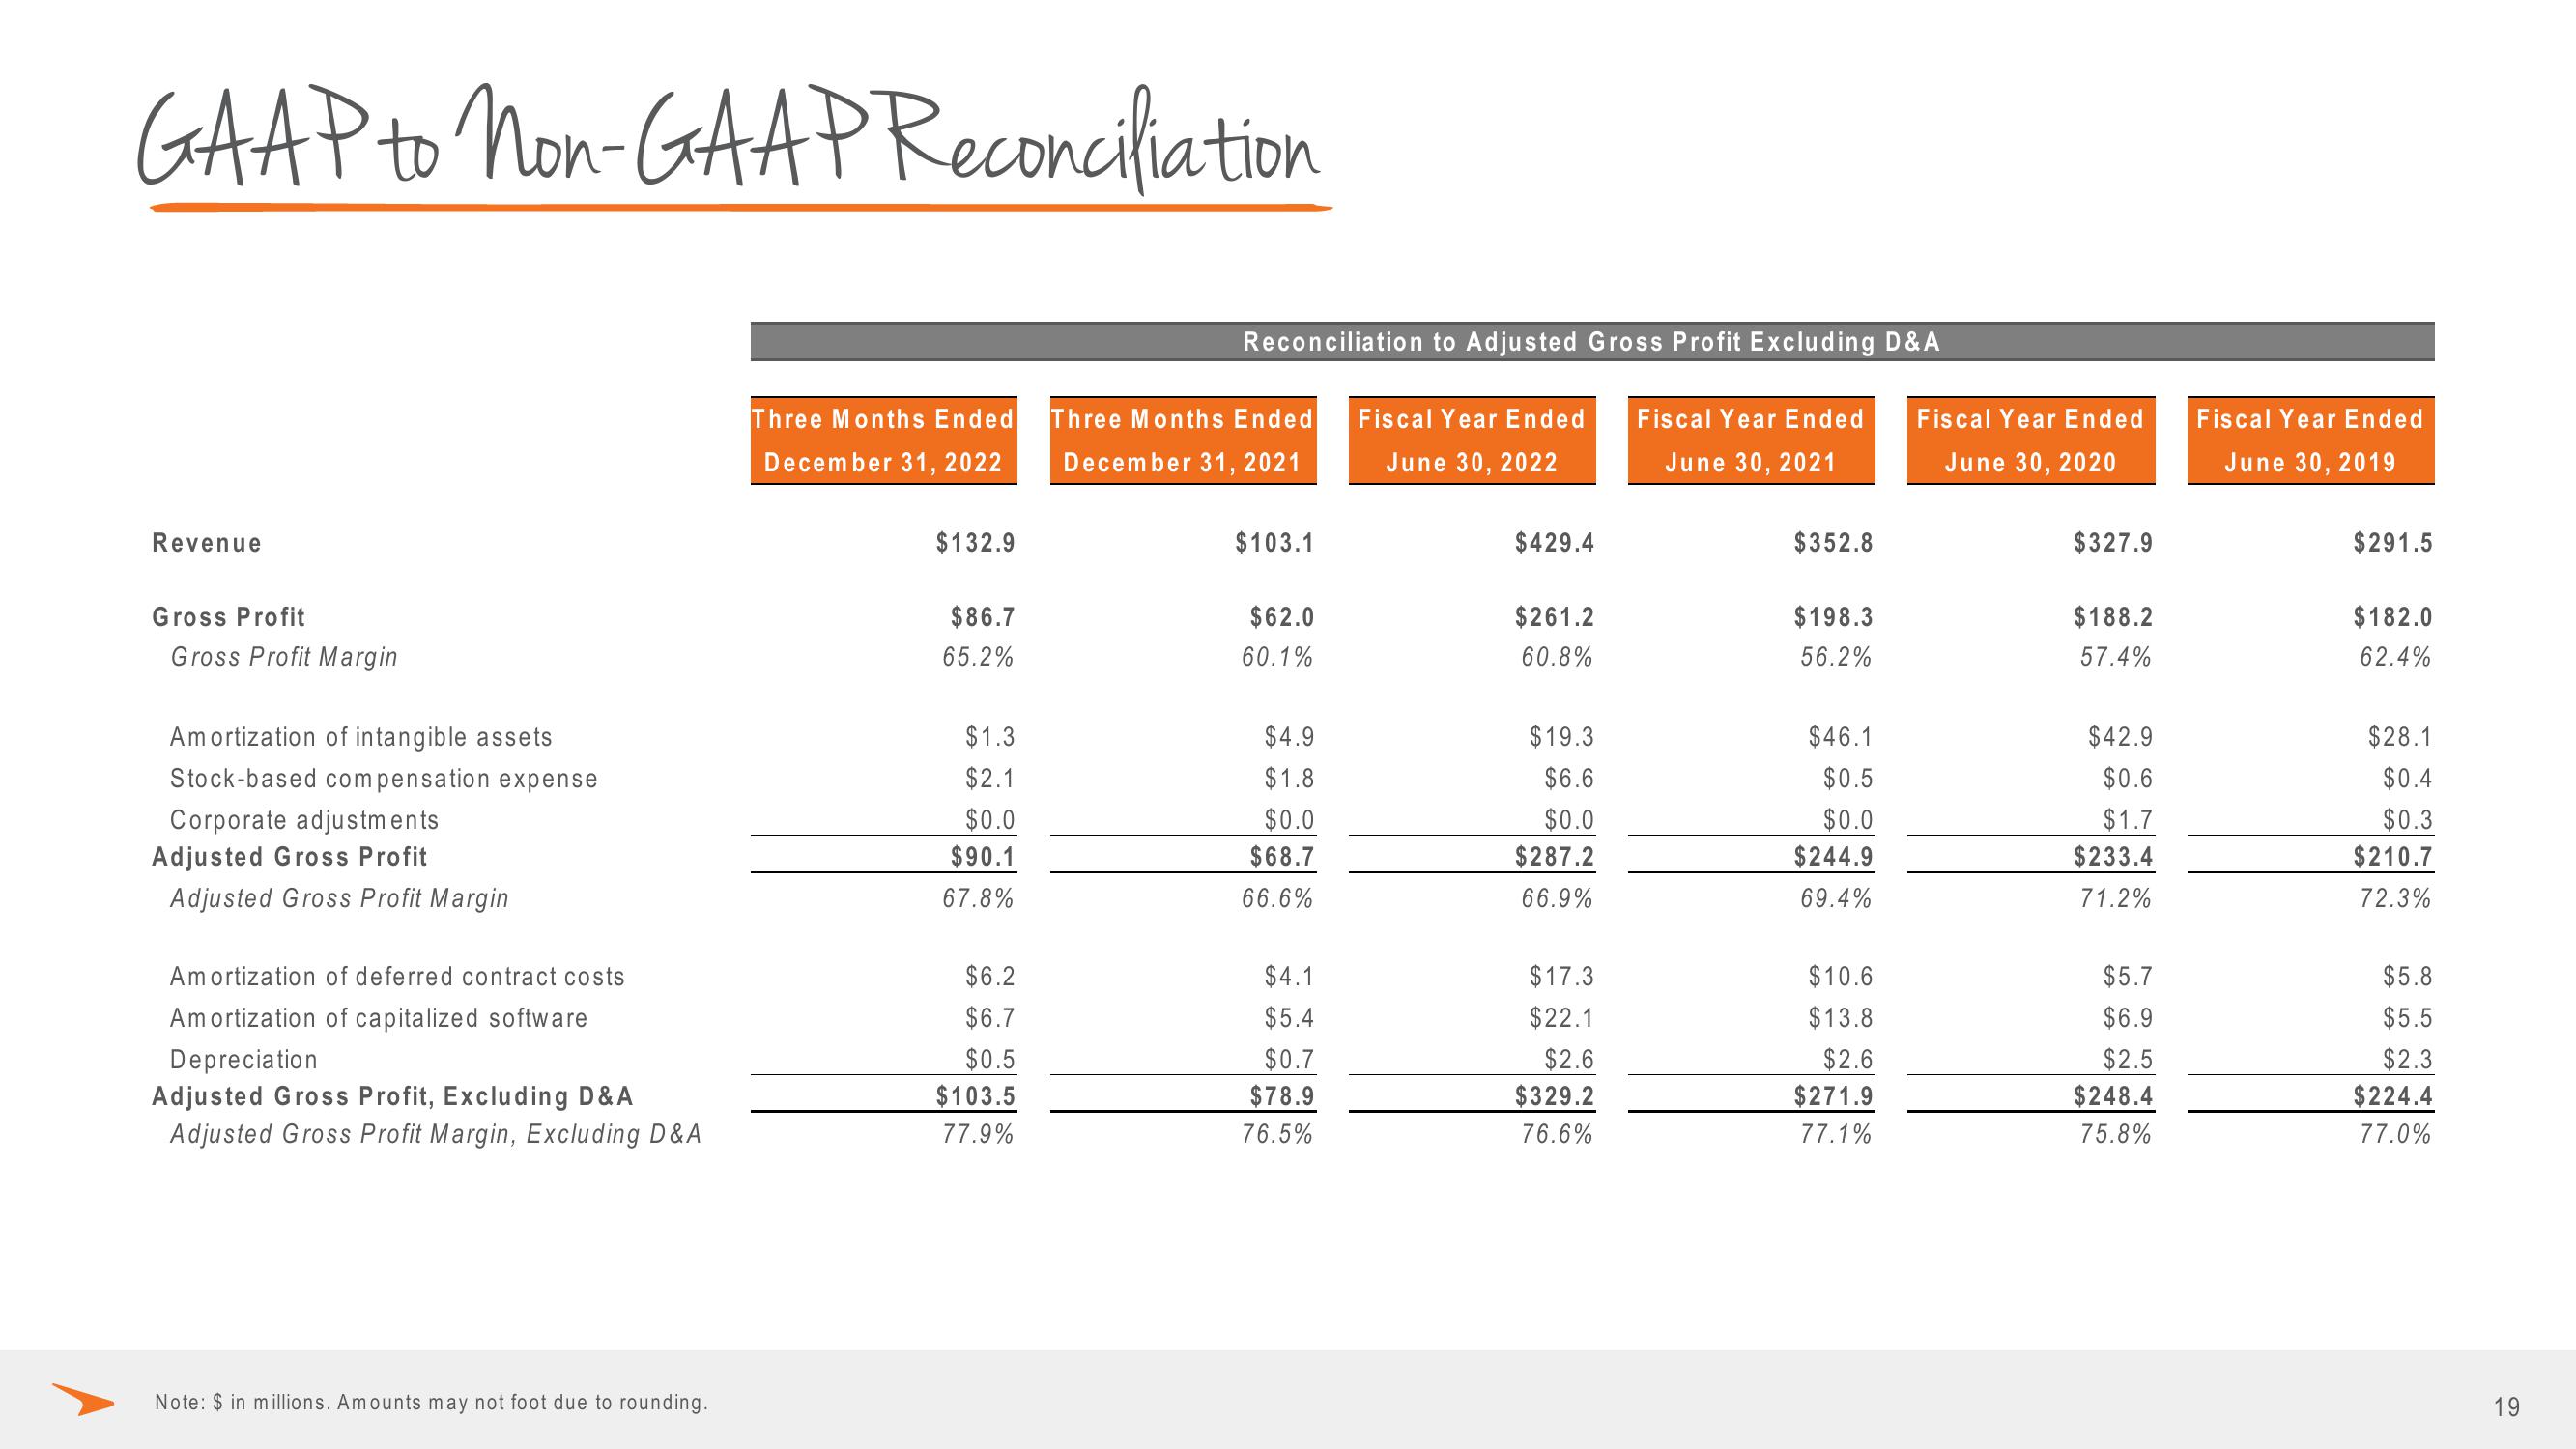
GAAP to Non-GAAP Reconciliation
Revenue
Gross Profit
Gross Profit Margin
Amortization of intangible assets
Stock-based compensation expense
Corporate adjustments
Adjusted Gross Profit
Adjusted Gross Profit Margin
Amortization of deferred contract costs
Amortization of capitalized software
Depreciation
Adjusted Gross Profit, Excluding D & A
Adjusted Gross Profit Margin, Excluding D&A
Note: $ in millions. Amounts may not foot due to rounding.
Three Months Ended
December 31, 2022
$132.9
$86.7
65.2%
$1.3
$2.1
$0.0
$90.1
67.8%
$6.2
$6.7
$0.5
$103.5
77.9%
Reconciliation to Adjusted Gross Profit Excluding D & A
Fiscal Year Ended
June 30, 2021
Three Months Ended
December 31, 2021
$103.1
$62.0
60.1%
$4.9
$1.8
$0.0
$68.7
66.6%
$4.1
$5.4
$0.7
$78.9
76.5%
Fiscal Year Ended
June 30, 2022
$429.4
$261.2
60.8%
$19.3
$6.6
$0.0
$287.2
66.9%
$17.3
$22.1
$2.6
$329.2
76.6%
$352.8
$198.3
56.2%
$46.1
$0.5
$0.0
$244.9
69.4%
$10.6
$13.8
$2.6
$271.9
77.1%
Fiscal Year Ended
June 30, 2020
$327.9
$188.2
57.4%
$42.9
$0.6
$1.7
$233.4
71.2%
$5.7
$6.9
$2.5
$248.4
75.8%
Fiscal Year Ended
June 30, 2019
$291.5
$182.0
62.4%
$28.1
$0.4
$0.3
$210.7
72.3%
$5.8
$5.5
$2.3
$224.4
77.0%
19View entire presentation