Allwyn Results Presentation Deck
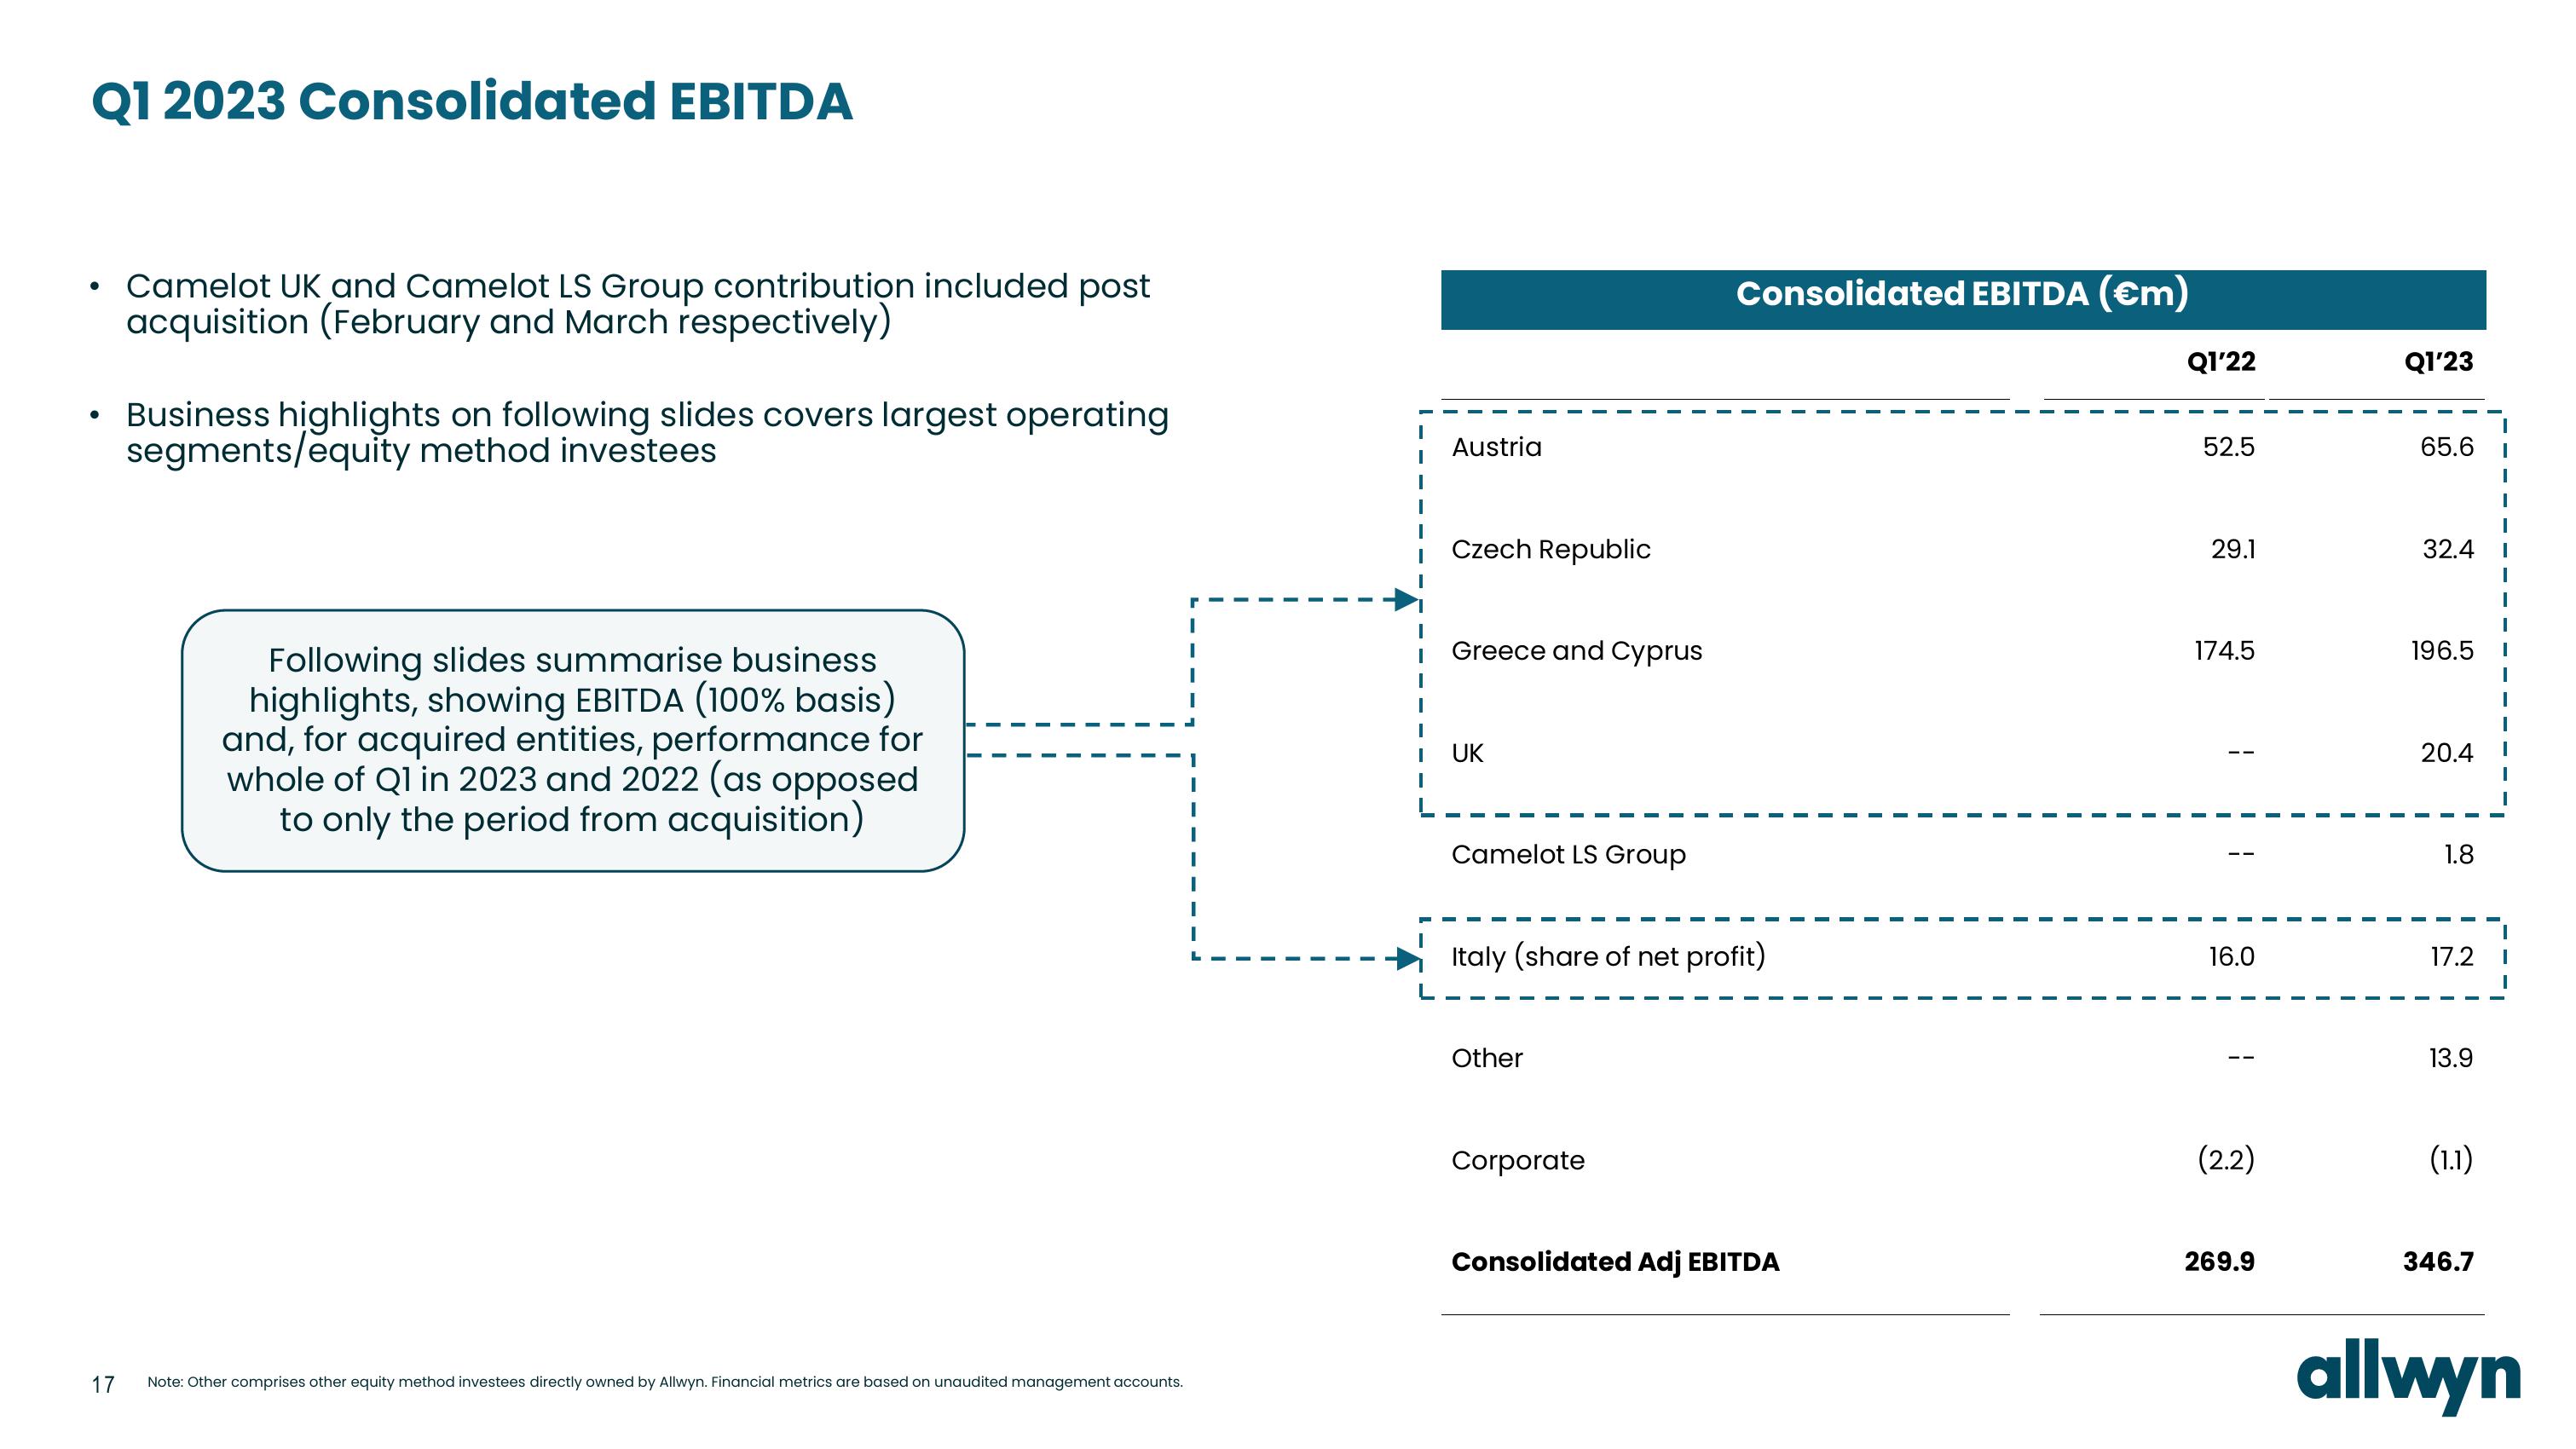
Q1 2023 Consolidated EBITDA
●
●
17
Camelot UK and Camelot LS Group contribution included post
acquisition (February and March respectively)
Business highlights on following slides covers largest operating
segments/equity method investees
Following slides summarise business
highlights, showing EBITDA (100% basis)
and, for acquired entities, performance for
whole of Q1 in 2023 and 2022 (as opposed
to only the period from acquisition)
Note: Other comprises other equity method investees directly owned by Allwyn. Financial metrics are based on unaudited management accounts.
Austria
Czech Republic
Greece and Cyprus
UK
Camelot LS Group
Italy (share of net profit)
Other
Consolidated EBITDA (€m)
Corporate
Consolidated Adj EBITDA
Q1'22
52.5
29.1
174.5
16.0
(2.2)
269.9
Q1'23
65.6
32.4
196.5
20.4
1.8
17.2
13.9
(1.1)
346.7
allwynView entire presentation