Barclays Credit Presentation Deck
STRATEGY, TARGETS
& GUIDANCE
10.8
46.0
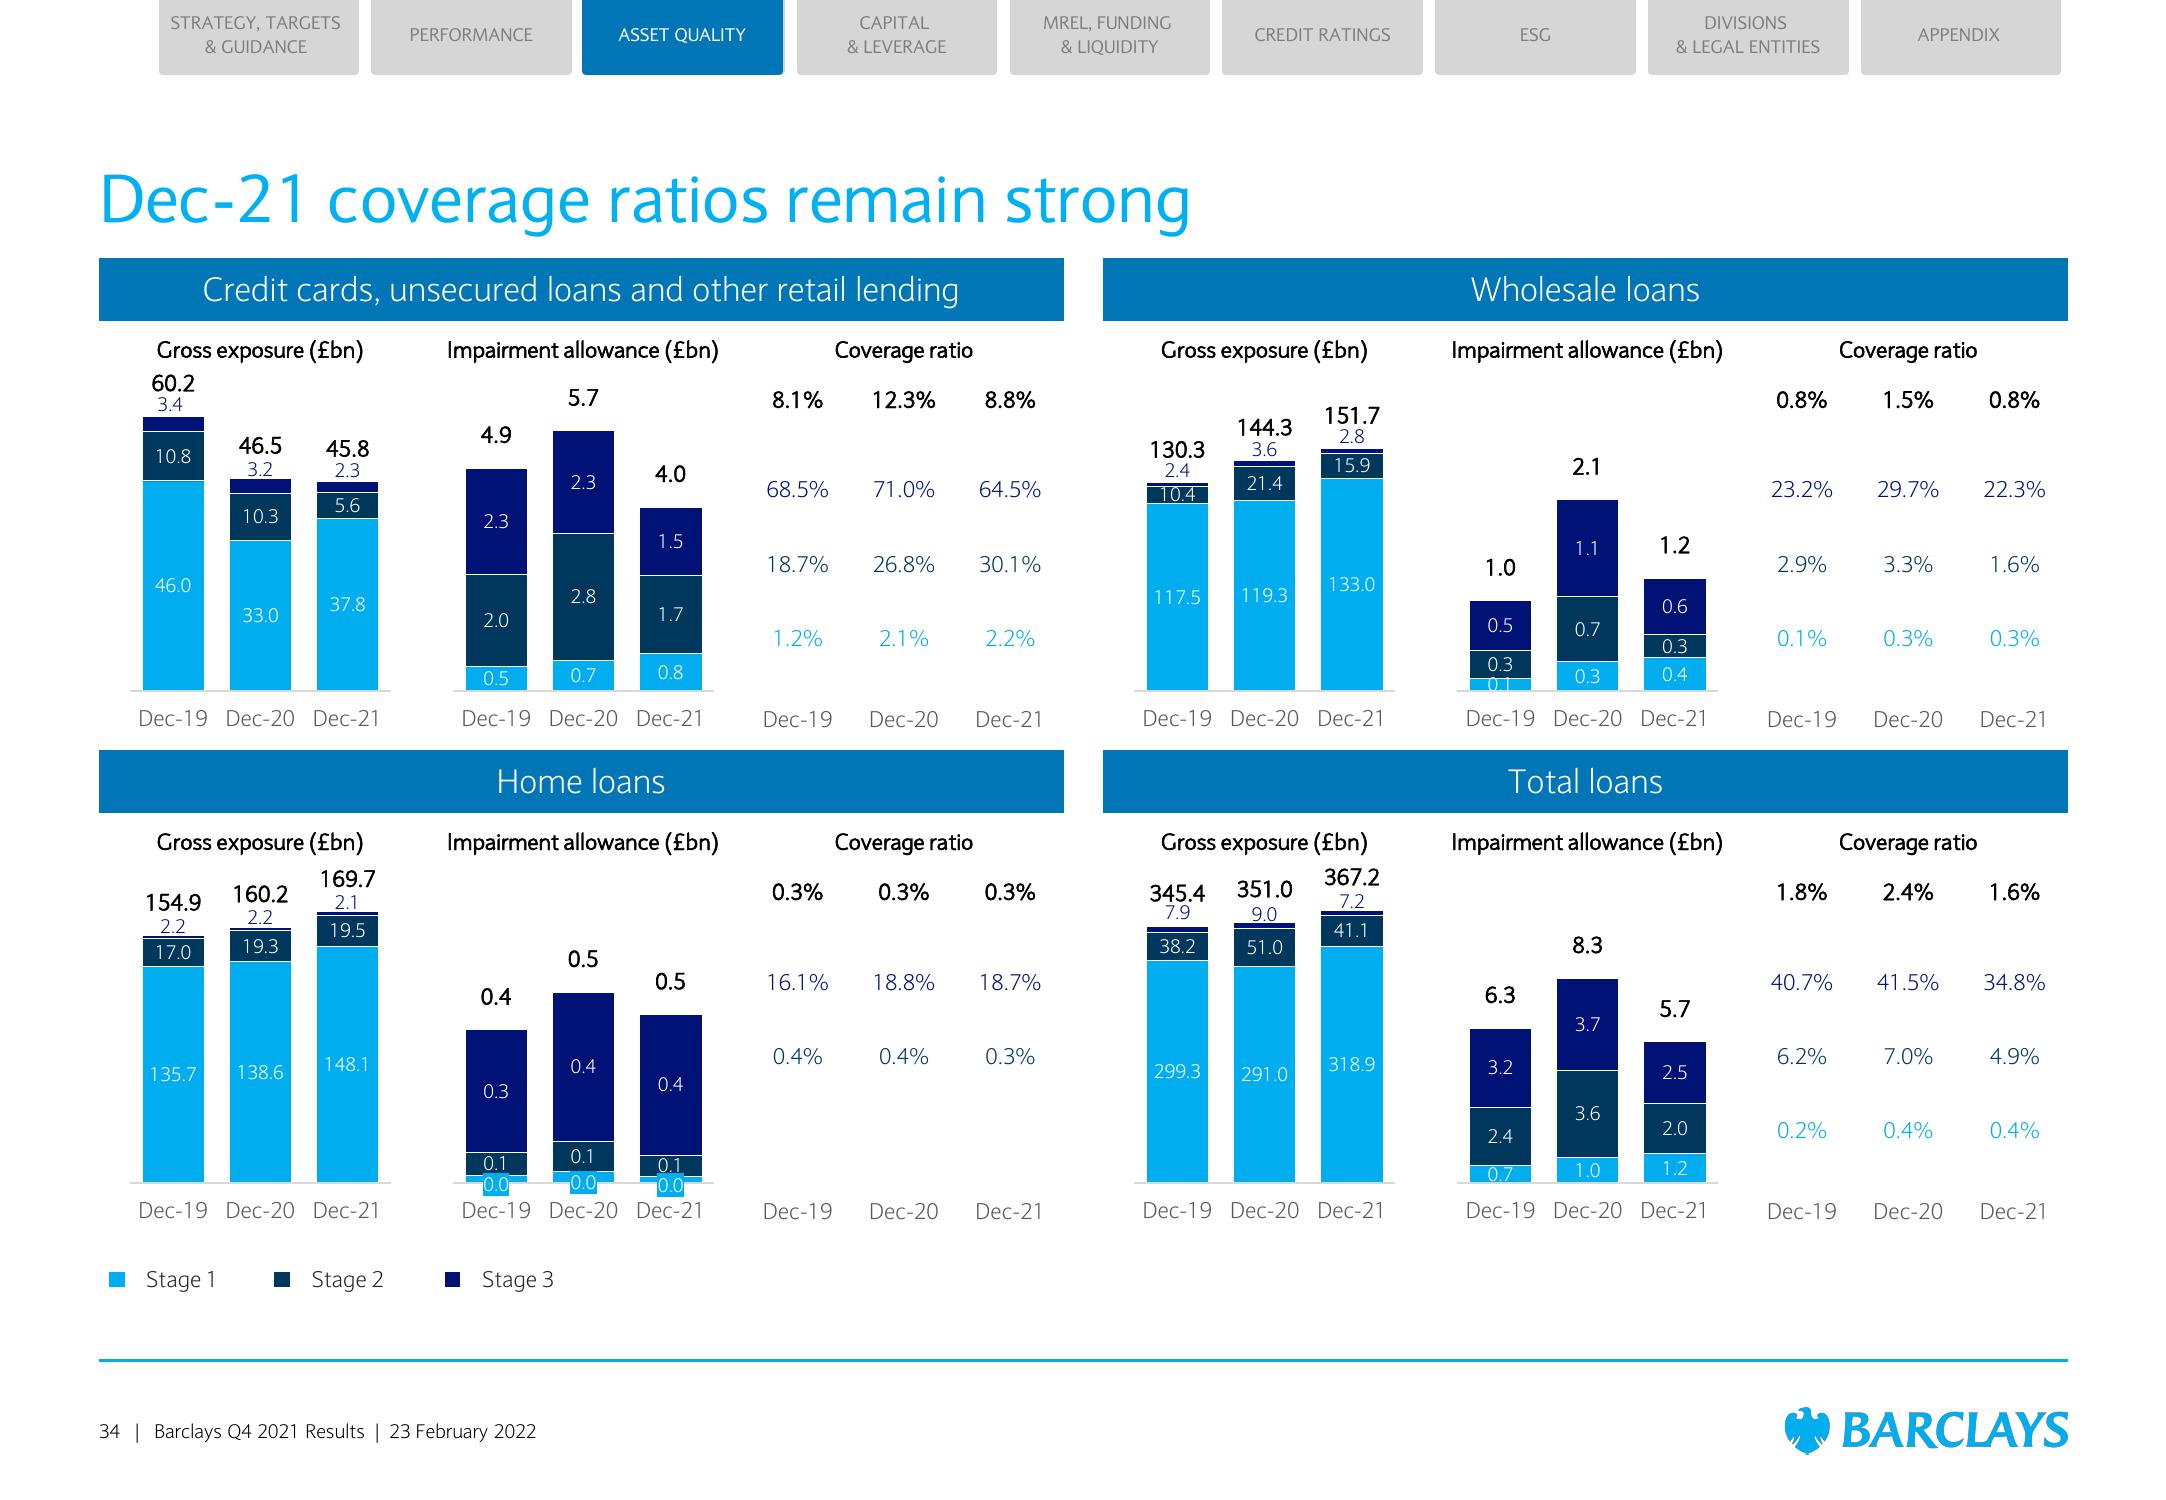
Dec-21 coverage ratios remain strong
Credit cards, unsecured loans and other retail lending
Gross exposure (£bn)
Impairment allowance (£bn)
60.2
Coverage ratio
12.3% 8.8%
3.4
5.7
154.9
2.2
46.5 45.8
3.2
2.3
5.6
Dec-19 Dec-20 Dec-21
17.0
10.3
33.0
Stage 1
37.8
160.2
2.2
Dec-19 Dec-20 Dec-21
PERFORMANCE
Stage 2
4.9
Gross exposure (£bn)
169.7
2.1
19.5
19.3
0.4
illa
148.1
135.7 138.6
0.3
2.3
2.0
2.3
2.8
■ Stage 3
34 | Barclays Q4 2021 Results | 23 February 2022
ASSET QUALITY
0.5
0.7
Dec-19 Dec-20 Dec-21
0.5
Home loans
Impairment allowance (£bn)
0.4
4.0
0.1
1.5
1.7
0.8
0.5
0.1
0.1
0.0
0.0
Dec-19 Dec-20 Dec-21
0.4
8.1%
68.5%
18.7%
1.2%
0.3%
CAPITAL
& LEVERAGE
16.1%
0.4%
71.0%
26.8% 30.1%
2.1%
Dec-19 Dec-20 Dec-21
Coverage ratio
0.3%
18.8%
64.5%
0.4%
Dec-19 Dec-20
2.2%
0.3%
18.7%
0.3%
MREL, FUNDING
& LIQUIDITY
Dec-21
Gross exposure (£bn)
151.7
2.8
15.9
130.3
2.4
10.4
CREDIT RATINGS
117.5
144.3
3.6
21.4
119.3
Dec-19 Dec-20 Dec-21
133.0
Gross exposure (£bn)
367.2
7.2
41.1
345.4 351.0
7.9
9.0
38.2
51.0
299.3 291.0
318.9
Dec-19 Dec-20 Dec-21
1.0
Wholesale loans
Impairment allowance (£bn)
ESG
6.3
2.1
3.2
1.1
0.5
0.3
0.3
OT
Dec-19 Dec-20 Dec-21
0.7
Total loans
Impairment allowance (£bn)
8.3
DIVISIONS
& LEGAL ENTITIES
3.7
3.6
1.2
0.6
0.3
0.4
1.0
5.7
2.5
2.4
2.0
1.2
0.7
Dec-19 Dec-20 Dec-21
0.8%
2.9%
0.1%
23.2% 29.7%
1.8%
APPENDIX
Coverage ratio
6.2%
1.5%
0.2%
3.3%
0.3%
Dec-19 Dec-20 Dec-21
Coverage ratio
40.7% 41.5%
2.4%
7.0%
0.4%
0.8%
Dec-19 Dec-20
22.3%
1.6%
0.3%
1.6%
34.8%
4.9%
0.4%
Dec-21
BARCLAYSView entire presentation