Nexters Results Presentation Deck
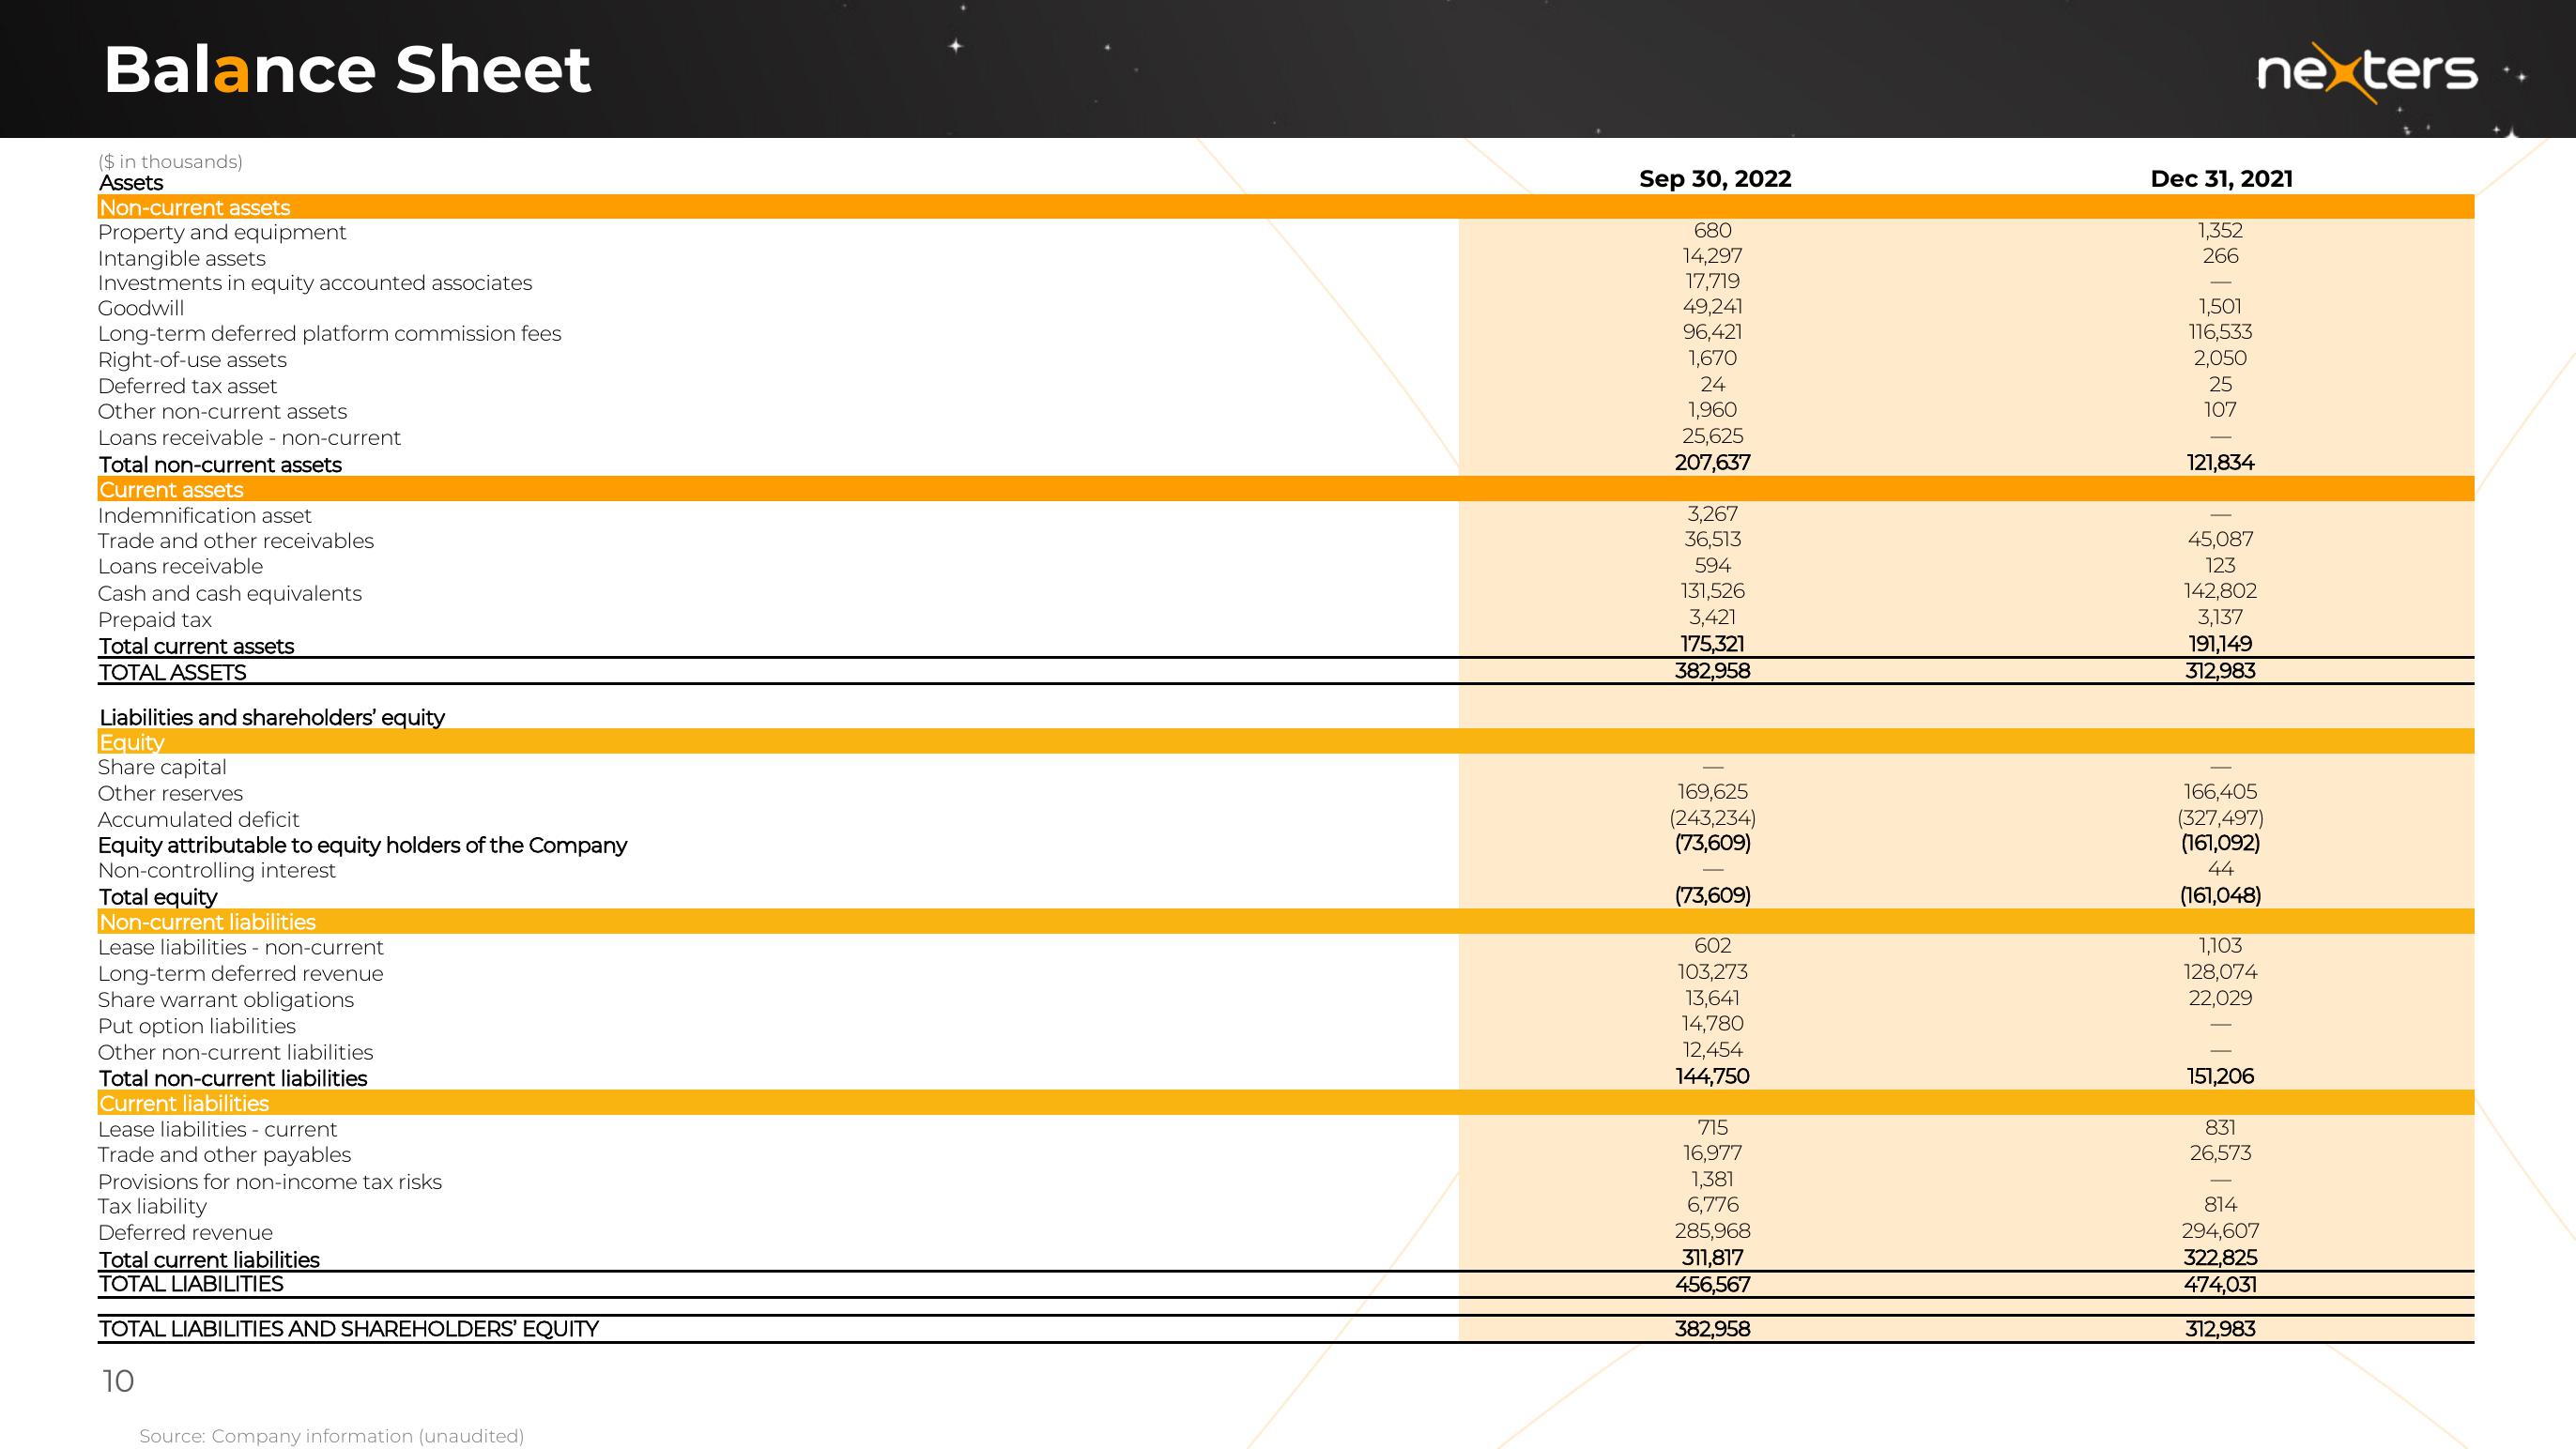
Balance Sheet
($ in thousands)
Assets
Non-current assets
Property and equipment
Intangible assets
Investments in equity accounted associates
Goodwill
Long-term deferred platform commission fees
Right-of-use assets
Deferred tax asset
Other non-current assets
Loans receivable - non-current
Total non-current assets
Current assets
Indemnification asset
Trade and other receivables
Loans receivable
Cash and cash equivalents
Prepaid tax
Total current assets
TOTAL ASSETS
Liabilities and shareholders' equity
Equity
Share capital
Other reserves
Accumulated deficit
Equity attributable to equity holders of the Company
Non-controlling interest
Total equity
Non-current liabilities
Lease liabilities - non-current
Long-term deferred revenue
Share warrant obligations
Put option liabilities
Other non-current liabilities
Total non-current liabilities
Current liabilities
Lease liabilities - current
Trade and other payables
Provisions for non-income tax risks
Tax liability
Deferred revenue
Total current liabilities
TOTAL LIABILITIES
TOTAL LIABILITIES AND SHAREHOLDERS' EQUITY
10
Source: Company information (unaudited)
Sep 30, 2022
680
14,297
17,719
49,241
96,421
1,670
24
1,960
25,625
207,637
3,267
36,513
594
131,526
3,421
175,321
382,958
169,625
(243,234)
(73,609)
(73,609)
602
103,273
13,641
14,780
12,454
144,750
715
16,977
1,381
6,776
285,968
311,817
456,567
382,958
Dec 31, 2021
1,352
266
1,501
116,533
2,050
25
107
121,834
45,087
123
142,802
3,137
191,149
312,983
nexters
166,405
(327,497)
(161,092)
44
(161,048)
1,103
128,074
22,029
151,206
831
26,573
814
294,607
322,825
474,031
312,983View entire presentation