FlexJet SPAC Presentation Deck
Scale/ Profitability
Business model
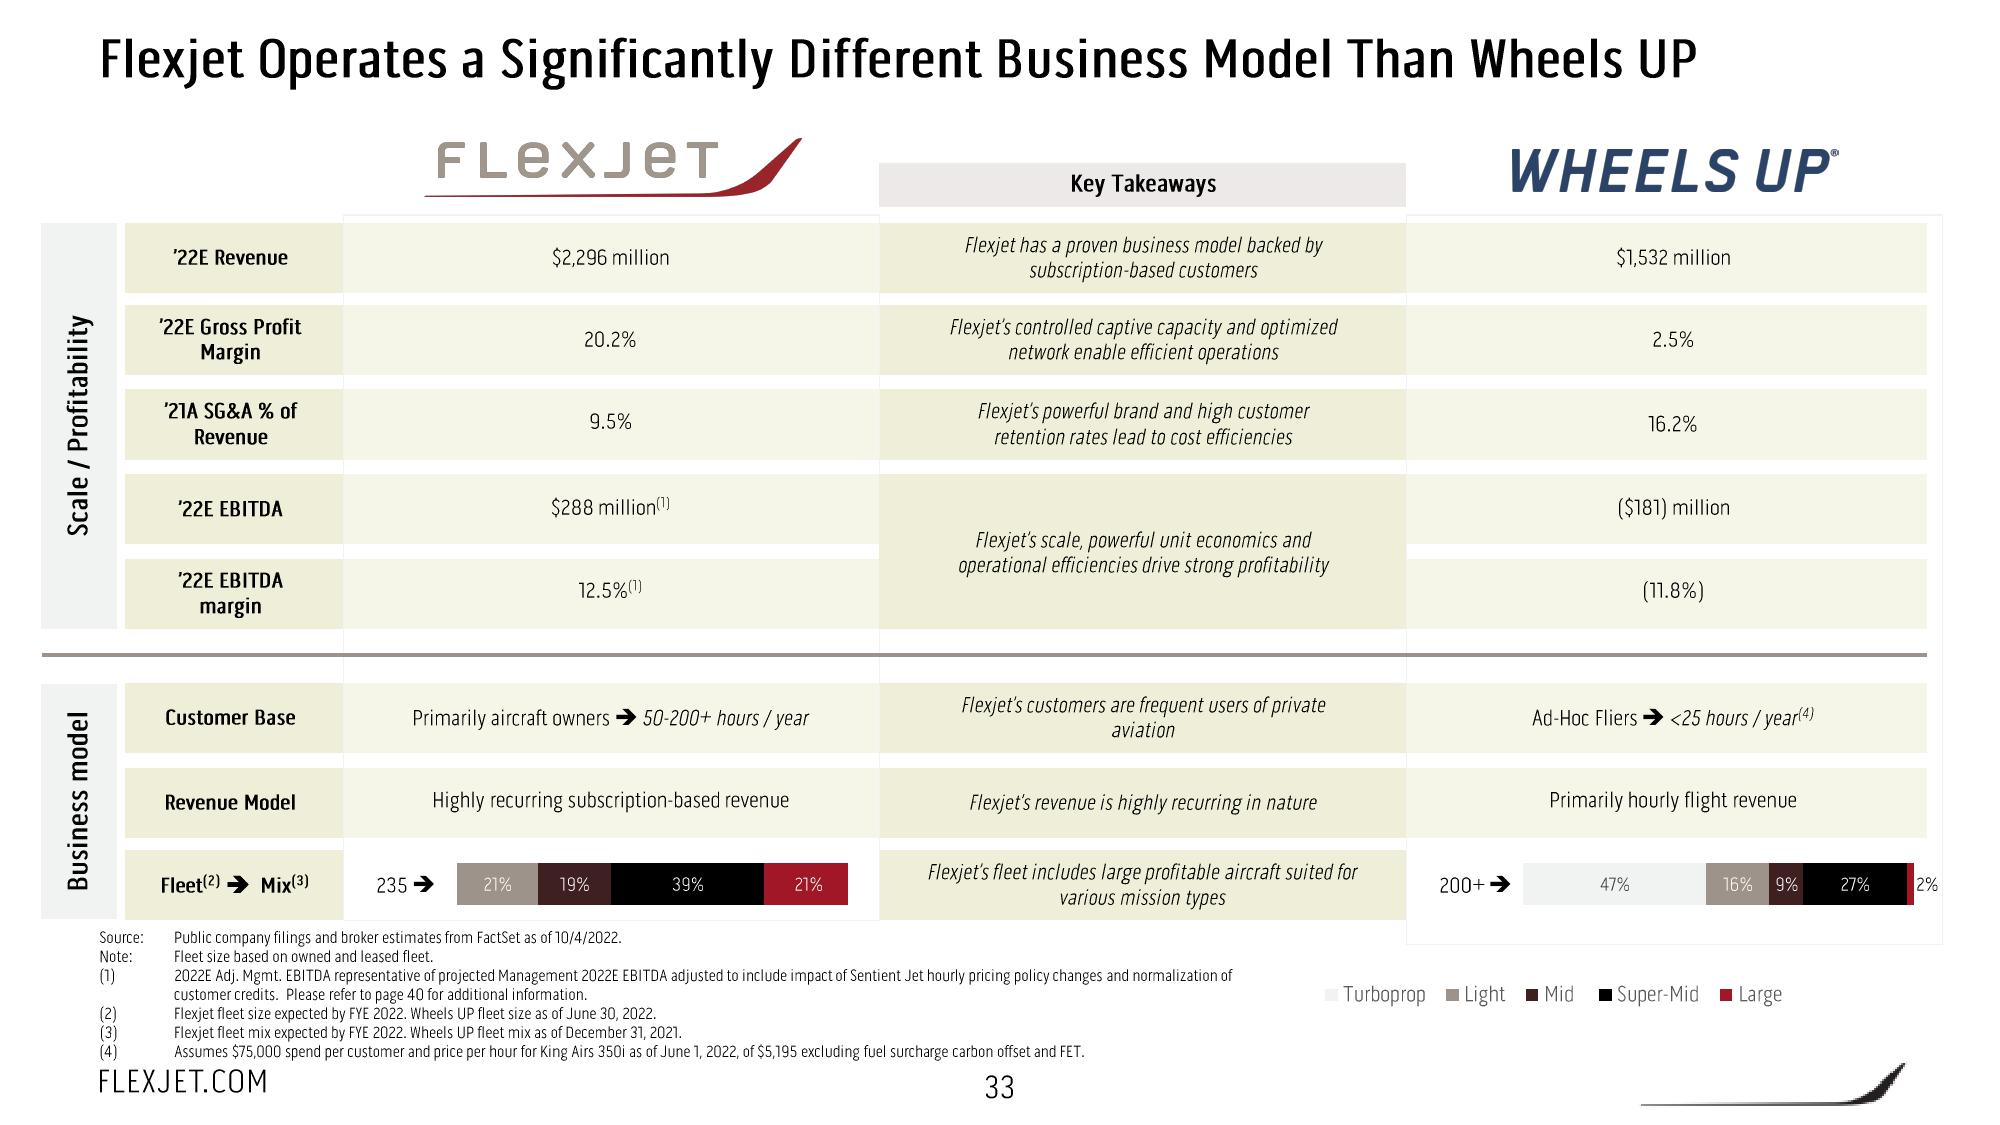
Flexjet Operates a Significantly Different Business Model Than Wheels UP
FLexJeT
WHEELS UPⓇ
Source:
Note:
(1)
¹22E Revenue
(2)
(3)
(4)
'22E Gross Profit
Margin
'21A SG&A % of
Revenue
'22E EBITDA
'22E EBITDA
margin
Customer Base
Revenue Model
Fleet(2) Mix(3)
235 →
$2,296 million
20.2%
21%
9.5%
$288 million(1)
Primarily aircraft owners 50-200+ hours/year
12.5%(1)
Highly recurring subscription-based revenue
19%
Public company filings and broker estimates from FactSet as of 10/4/2022.
Fleet size based on owned and leased fleet.
39%
21%
Key Takeaways
Flexjet has a proven business model backed by
subscription-based customers
Flexjet's controlled captive capacity and optimized
network enable efficient operations
Flexjet's powerful brand and high customer
retention rates lead to cost efficiencies
Flexjet's scale, powerful unit economics and
operational efficiencies drive strong profitability
Flexjet's customers are frequent users of private
aviation
Flexjet's revenue is highly recurring in nature
Flexjet's fleet includes large profitable aircraft suited for
various mission types
2022E Adj. Mgmt. EBITDA representative of projected Management 2022E EBITDA adjusted to include impact of Sentient Jet hourly pricing policy changes and normalization of
customer credits. Please refer to page 40 for additional information.
Flexjet fleet size expected by FYE 2022. Wheels UP fleet size as of June 30, 2022.
Flexjet fleet mix expected by FYE 2022. Wheels UP fleet mix as of December 31, 2021.
Assumes $75,000 spend per customer and price per hour for King Airs 350i as of June 1, 2022, of $5,195 excluding fuel surcharge carbon offset and FET.
FLEXJET.COM
33
200+
Turboprop Light
$1,532 million
Mid
2.5%
16.2%
($181) million
Ad-Hoc Fliers → <25 hours / year(4)
47%
(11.8%)
Primarily hourly flight revenue
16% 9%
Super-Mid Large
27%
2%View entire presentation