Owens&Minor Investor Day Presentation Deck
92
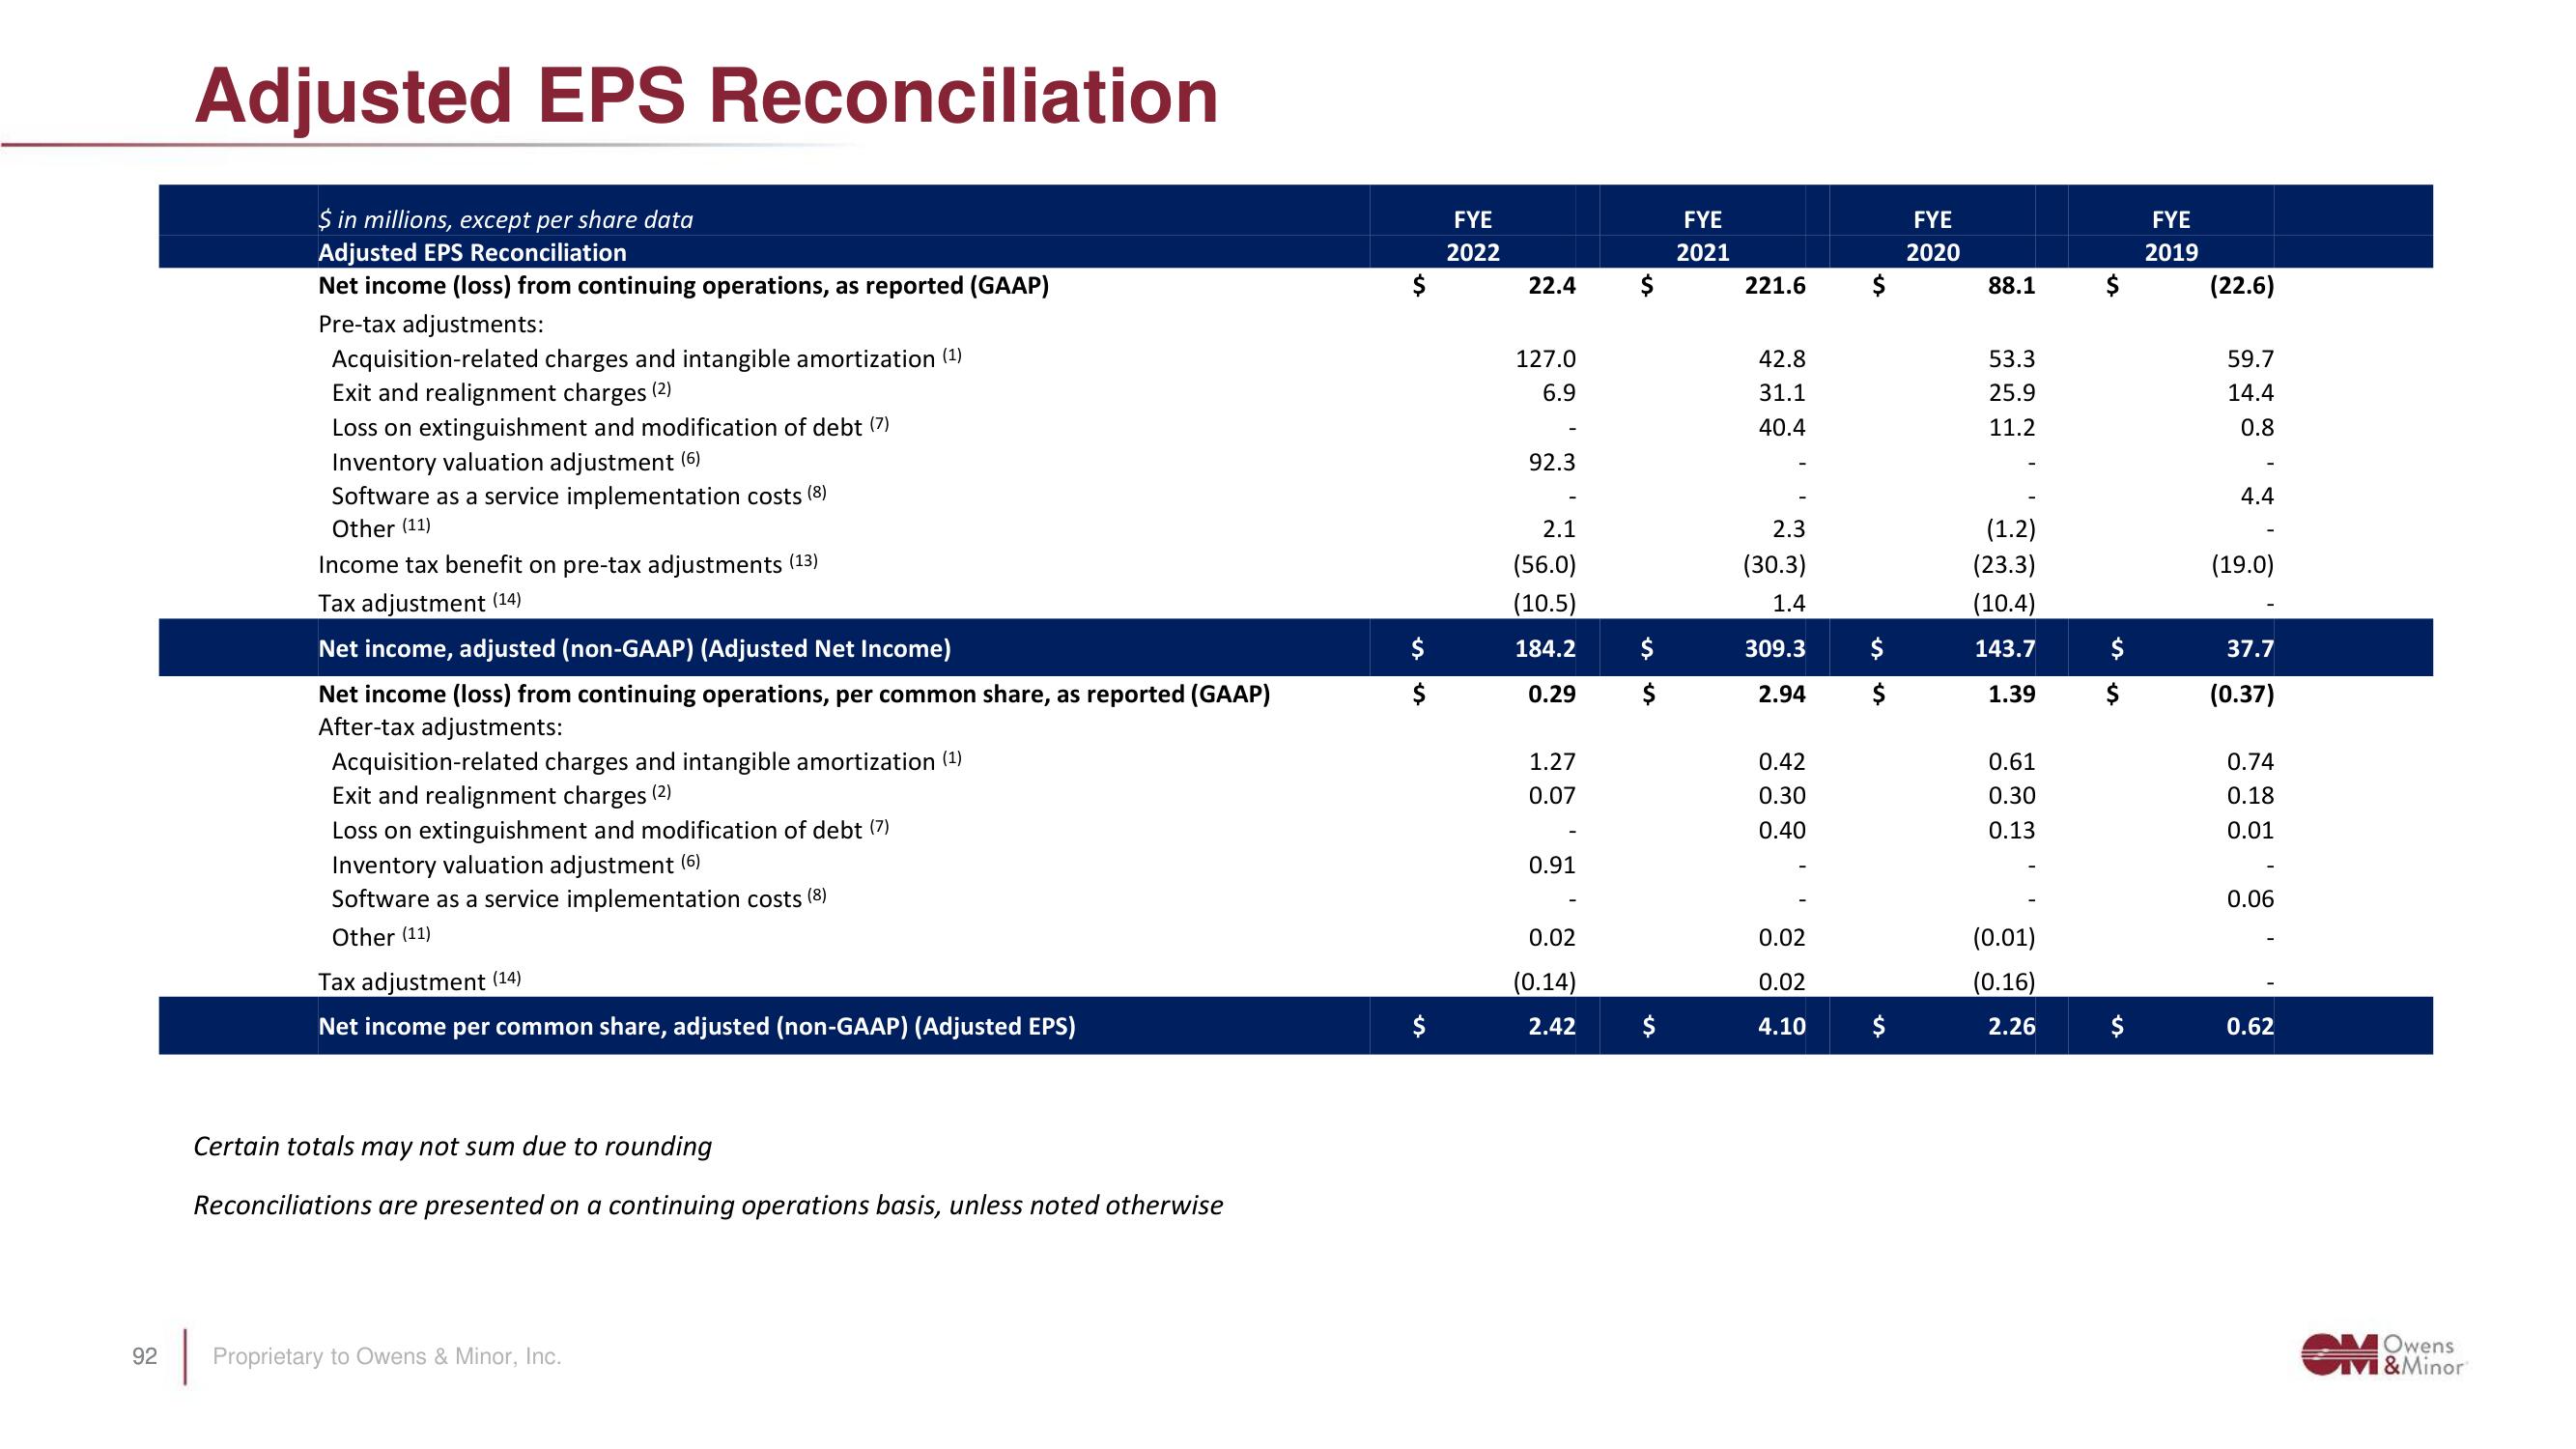
Adjusted EPS Reconciliation
$ in millions, except per share data
Adjusted EPS Reconciliation
Net income (loss) from continuing operations, as reported (GAAP)
Pre-tax adjustments:
Acquisition-related charges and intangible amortization (1)
Exit and realignment charges (2)
Loss on extinguishment and modification of debt (7)
Inventory valuation adjustment (6)
Software as a service implementation costs (8)
Other (11)
Income tax benefit on pre-tax adjustments (13)
Tax adjustment (14)
Net income, adjusted (non-GAAP) (Adjusted Net Income)
Net income (loss) from continuing operations, per common share, as reported (GAAP)
After-tax adjustments:
Acquisition-related charges and intangible amortization (¹)
Exit and realignment charges (2)
Loss on extinguishment and modification of debt (7)
Inventory valuation adjustment (6)
Software as a service implementation costs (8)
Other (11)
Tax adjustment (14)
Net income per common share, adjusted (non-GAAP) (Adjusted EPS)
Certain totals may not sum due to rounding
Reconciliations are presented on a continuing operations basis, unless noted otherwise
Proprietary to Owens & Minor, Inc.
$
$
FYE
2022
22.4
127.0
6.9
92.3
2.1
(56.0)
(10.5)
184.2
0.29
1.27
0.07
0.91
0.02
(0.14)
2.42
$
$
FYE
2021
221.6
42.8
31.1
40.4
2.3
(30.3)
1.4
309.3
2.94
0.42
0.30
0.40
0.02
0.02
4.10
$
$
$
FYE
2020
88.1
53.3
25.9
11.2
(1.2)
(23.3)
(10.4)
143.7
1.39
0.61
0.30
0.13
(0.01)
(0.16)
2.26
$
$
$
FYE
2019
(22.6)
59.7
14.4
0.8
4.4
(19.0)
37.7
(0.37)
0.74
0.18
0.01
0.06
0.62
MOwens
M&MinorView entire presentation