OmniAb Investor Presentation Deck
Performance Indicators
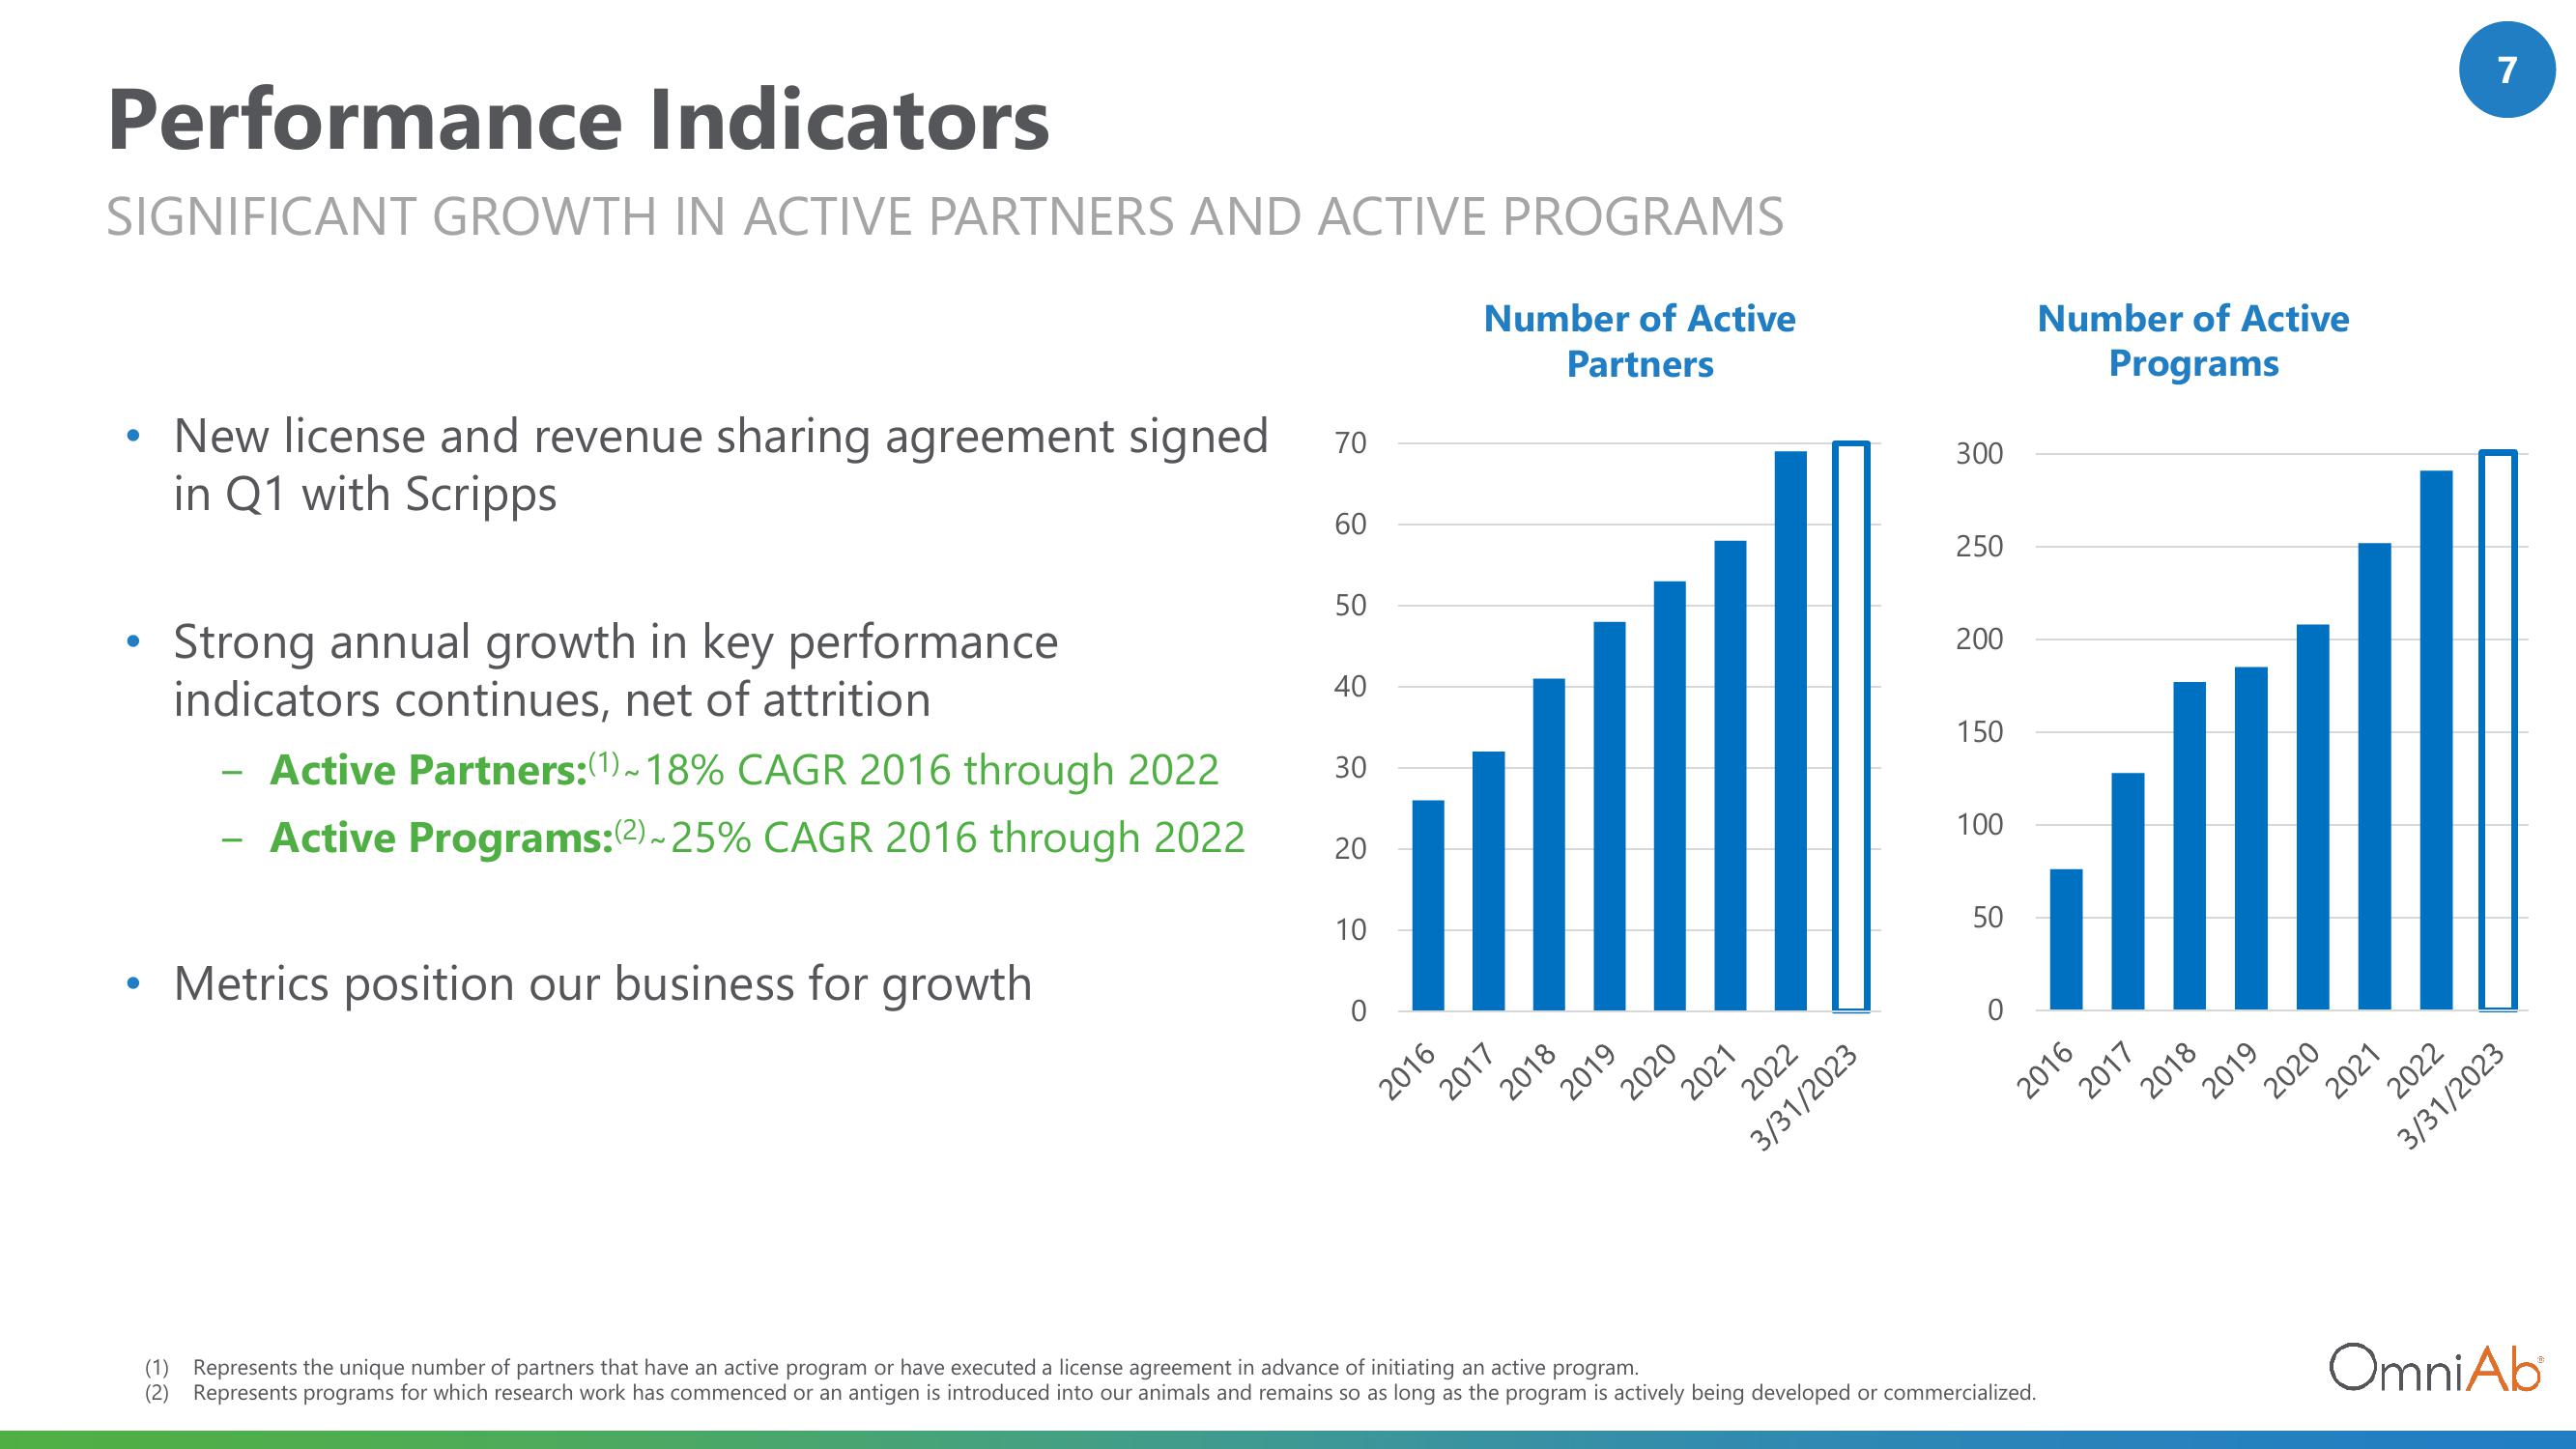
SIGNIFICANT GROWTH IN ACTIVE PARTNERS AND ACTIVE PROGRAMS
• New license and revenue sharing agreement signed 70
in Q1 with Scripps
●
●
Strong annual growth in key performance
indicators continues, net of attrition
Active Partners:(1)~18% CAGR 2016 through 2022
Active Programs:(2) ~25% CAGR 2016 through 2022
Metrics position our business for growth
60
50
40
30
20
10
0
Number of Active
Partners
2016
2017
2018
2019
2020
2021
2022
3/31/2023
300
250
200
150
100
50
0
Number of Active
Programs
2016
(1) Represents the unique number of partners that have an active program or have executed a license agreement in advance of initiating an active program.
(2) Represents programs for which research work has commenced or an antigen is introduced into our animals and remains so as long as the program is actively being developed or commercialized.
2017
2018
2019
2020
2022
2021
7
3/31/2023
OmniAbView entire presentation