BAT Results Presentation Deck
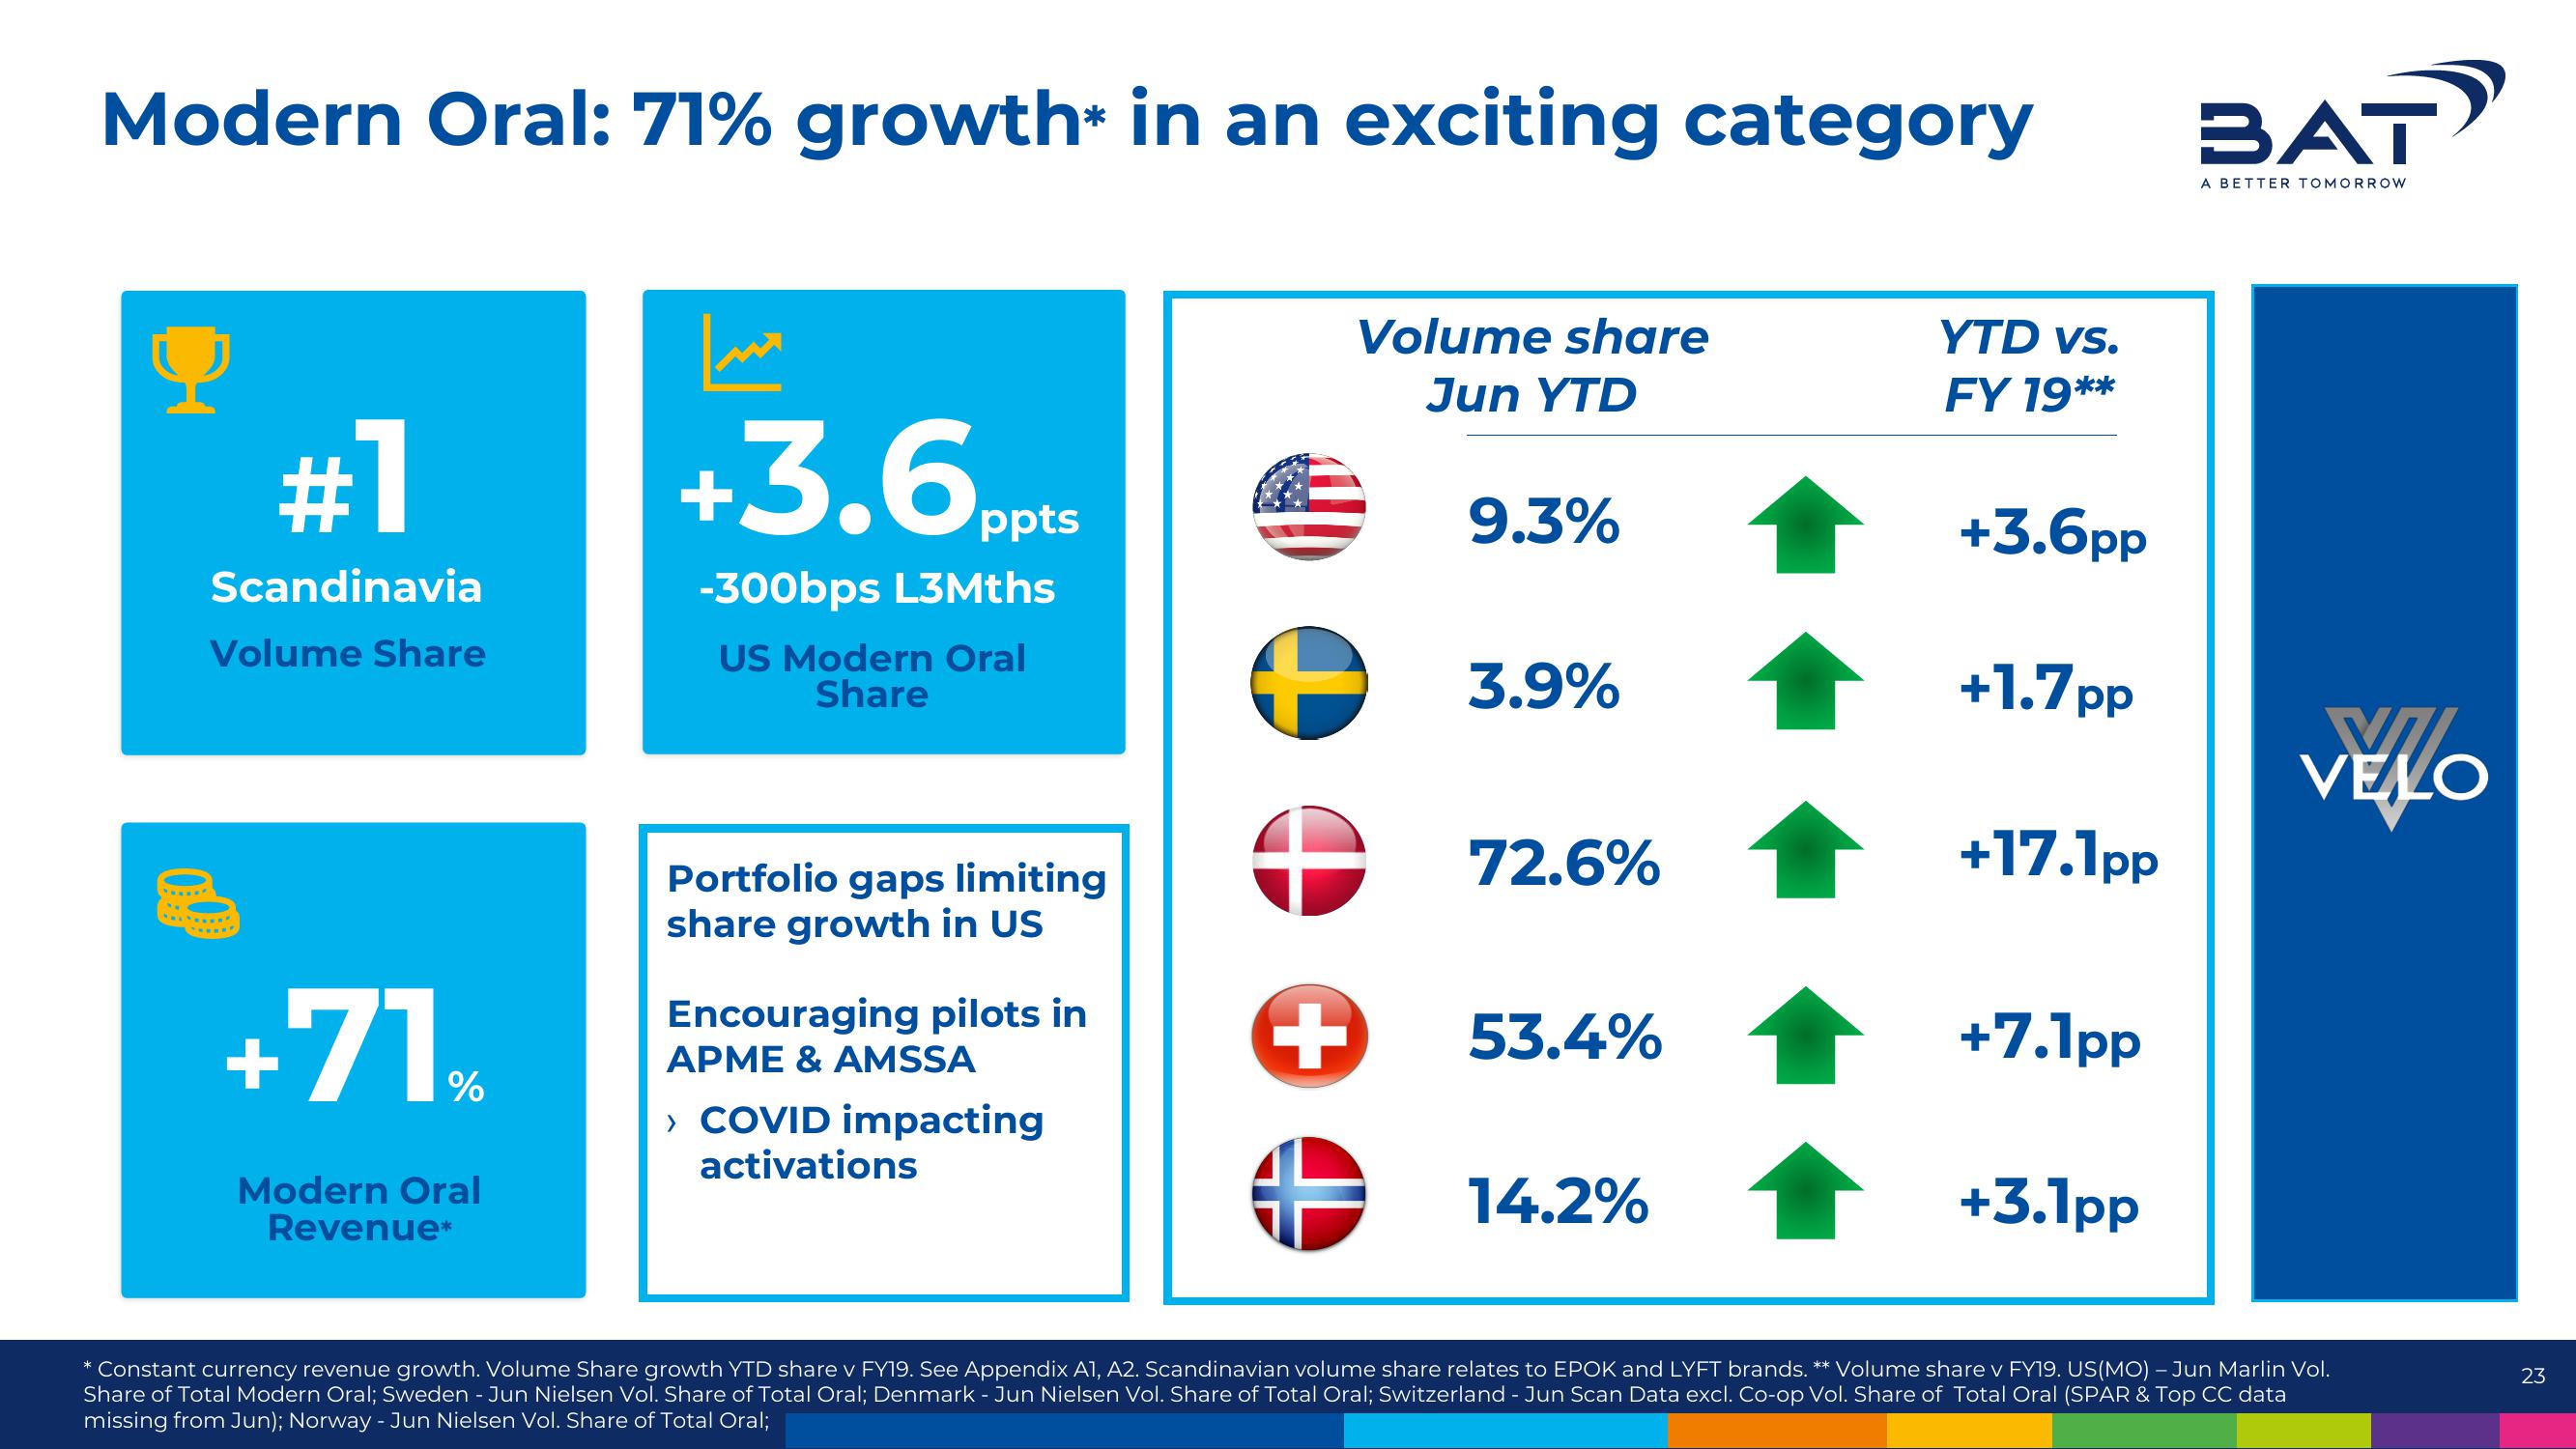
Modern Oral: 71% growth in an exciting category
#1
Scandinavia
Volume Share
+71.
%
Modern Oral
Revenue*
+3.6 ppts
-300bps L3Mths
US Modern Oral
Share
Portfolio gaps limiting
share growth in US
Encouraging pilots in
APME & AMSSA
› COVID impacting
activations
Volume share
Jun YTD
+
+
+
9.3%
3.9%
72.6%
53.4%
14.2%
YTD vs.
FY 19**
+3.6pp
+1.7pp
+17.1pp
+7.1pp
+3.1pp
BAT
A BETTER TOMORROW
VI
VELO
Constant currency revenue growth. Volume Share growth YTD share v FY19. See Appendix A1, A2. Scandinavian volume share relates to EPOK and LYFT brands. ** Volume share v FY19. US(MO) - Jun Marlin Vol.
Share of Total Modern Oral; Sweden - Jun Nielsen Vol. Share of Total Oral; Denmark - Jun Nielsen Vol. Share of Total Oral; Switzerland - Jun Scan Data excl. Co-op Vol. Share of Total Oral (SPAR & Top CC data
missing from Jun); Norway - Jun Nielsen Vol. Share of Total Oral;
23View entire presentation