FAT Brands Results Presentation Deck
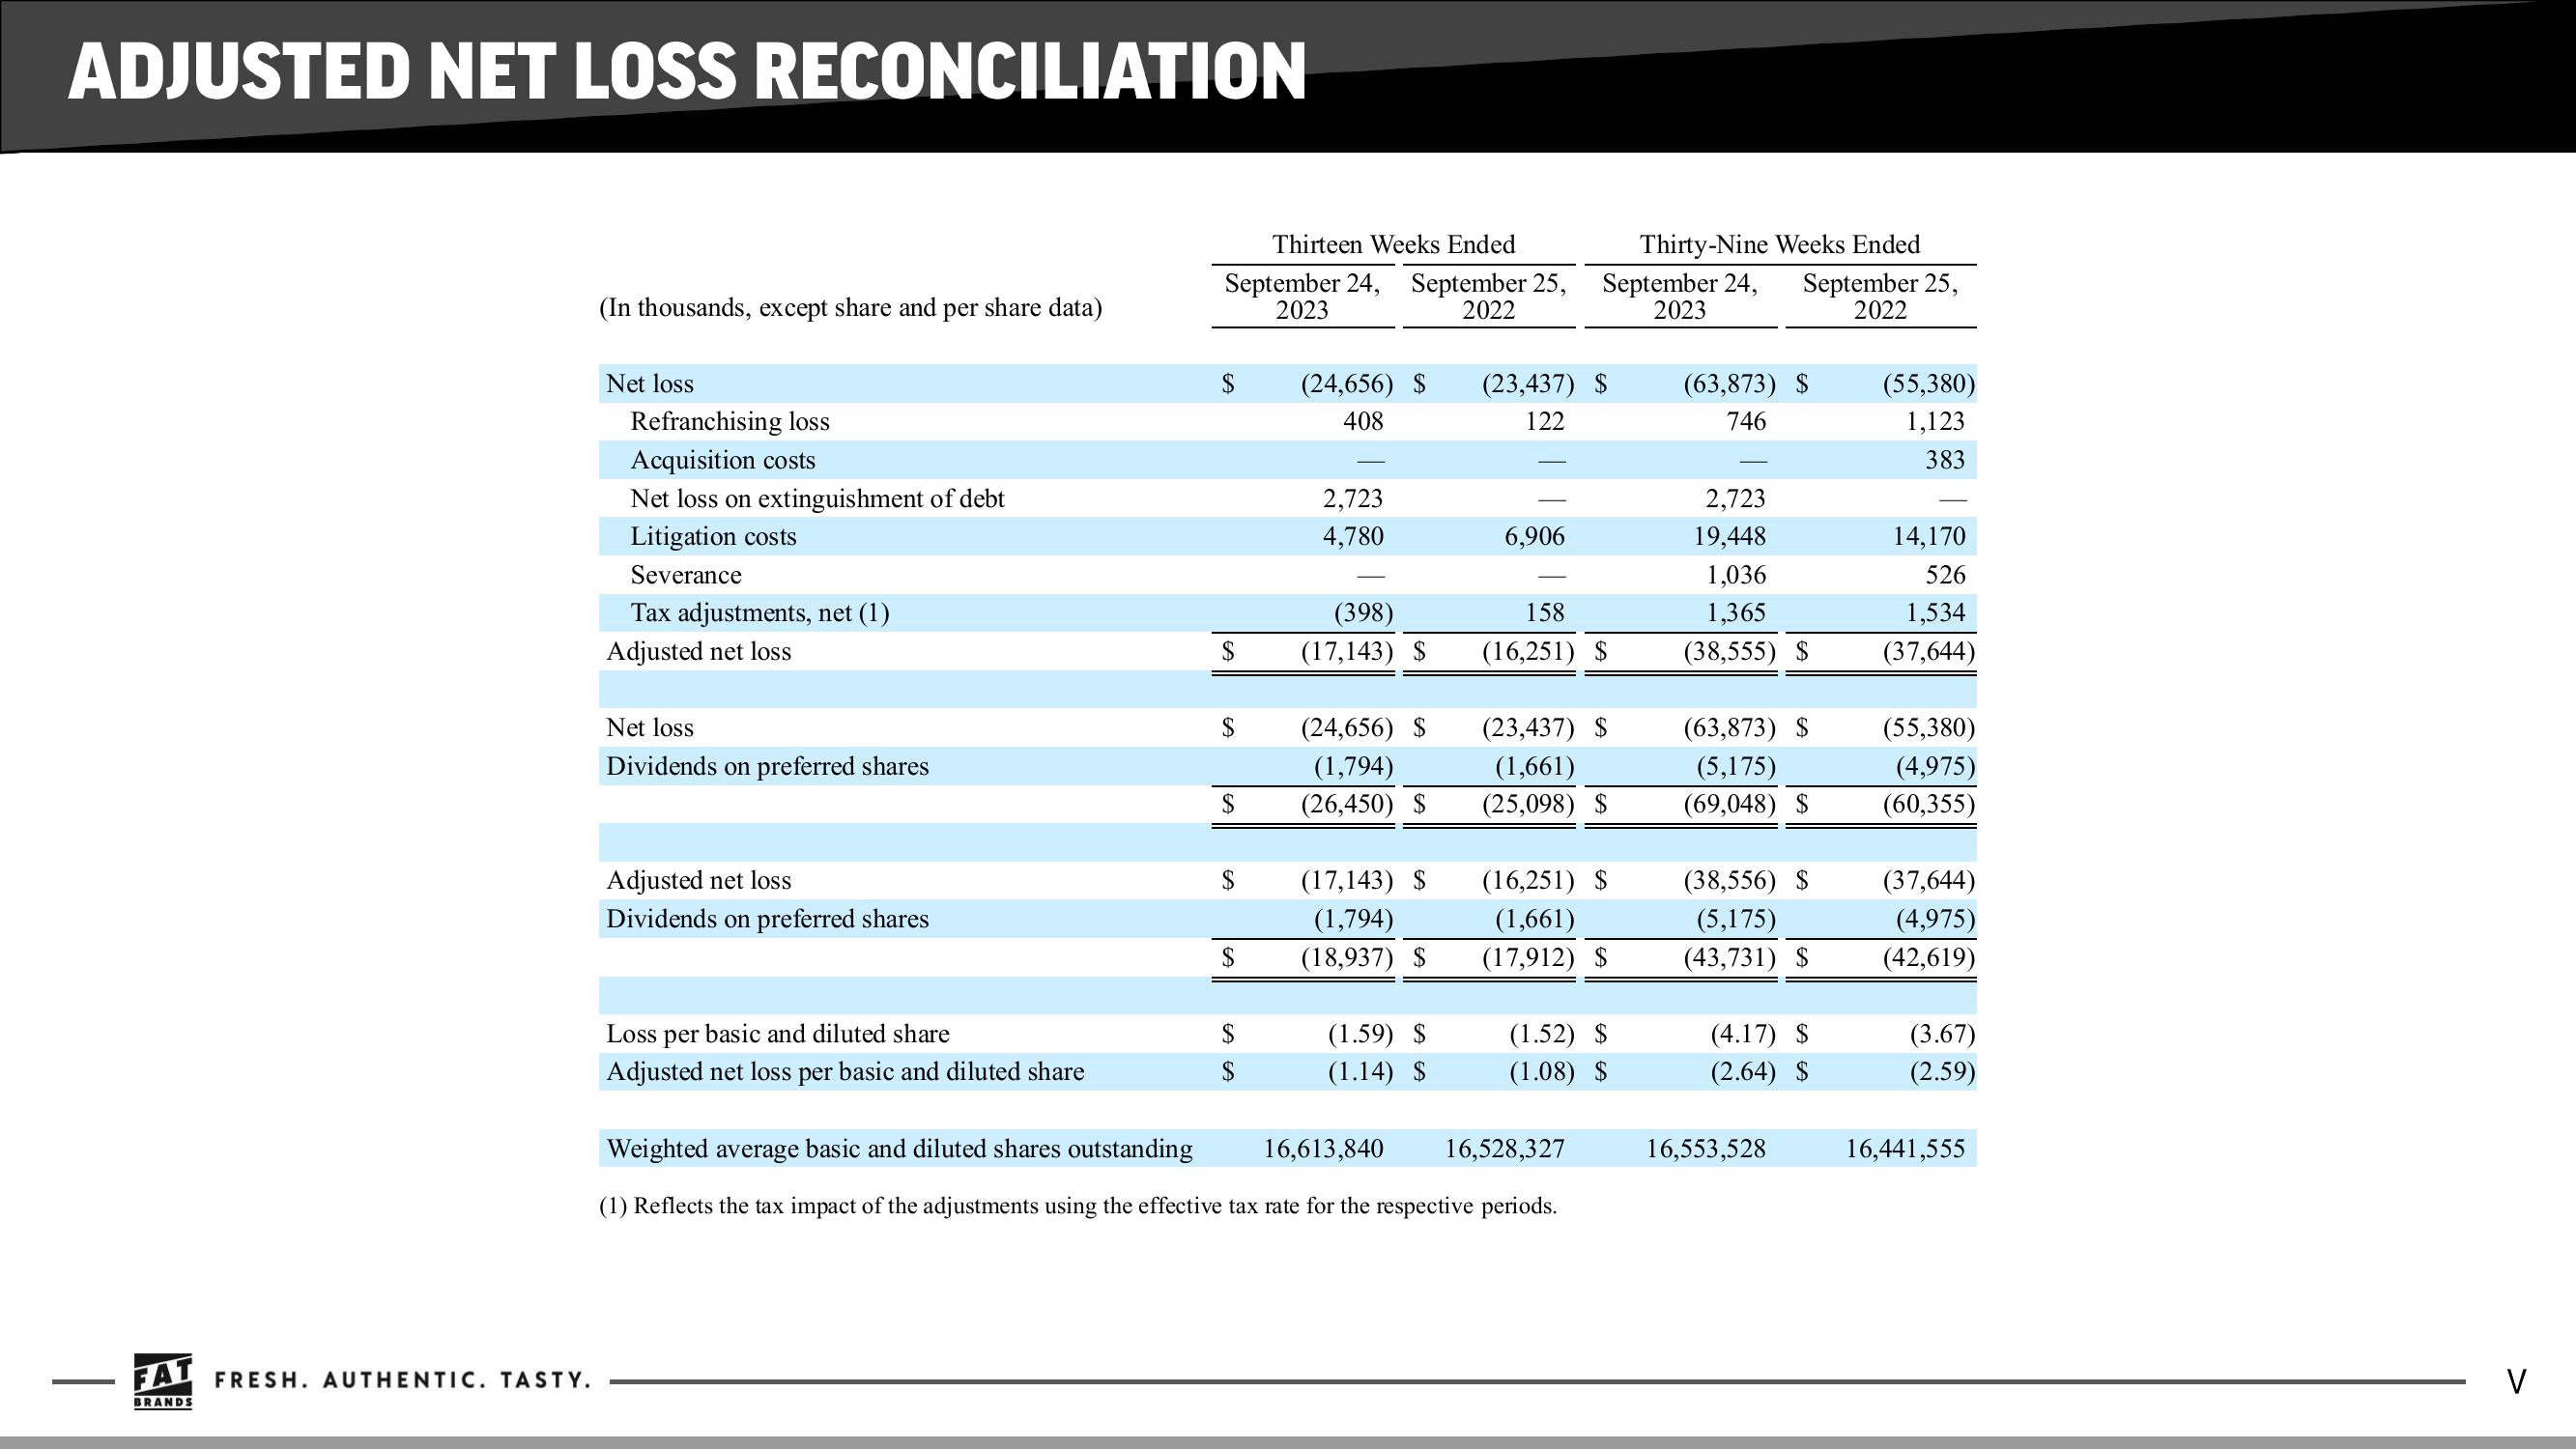
ADJUSTED NET LOSS RECONCILIATION
I
FAT FRESH. AUTHENTIC. TASTY.
BRANDS
(In thousands, except share and per share data)
Net loss
Refranchising loss
Acquisition costs
Net loss on extinguishment of debt
Litigation costs
Severance
Tax adjustments, net (1)
Adjusted net loss
Net loss
Dividends on preferred shares
Adjusted net loss
Dividends on preferred shares
Loss per basic and diluted share
Adjusted net loss per basic and diluted share
Thirteen Weeks Ended
Thirty-Nine Weeks Ended
September 24, September 25, September 24, September 25,
2023
2022
2023
2022
$
$
$
$
$
$
$
$
(24,656) $
408
2,723
4,780
(398)
(17,143) $
(24,656)
(1,794)
(26,450) $
(17,143) $
(1,794)
(18,937) $
(1.59) $
(1.14) $
(23,437) $
122
6,906
158
(16,251) $
(23,437) $
(1,661)
(25,098) $
(16,251) $
(1,661)
(17,912) $
(1.52) $
(1.08) $
Weighted average basic and diluted shares outstanding
16,613,840
16,528,327
(1) Reflects the tax impact of the adjustments using the effective tax rate for the respective periods.
(63,873) $
746
2,723
19,448
1,036
1,365
(38,555) $
(63,873)
(5,175)
(69,048) $
(38,556) $
(5,175)
(43,731) $
(4.17)
(2.64) $
16,553,528
(55,380)
1,123
383
14,170
526
1,534
(37,644)
(55,380)
(4,975)
(60,355)
(37,644)
(4,975)
(42,619)
(3.67)
(2.59)
16,441,555
VView entire presentation