Inovalon Results Presentation Deck
Q3 2017 - Continued Sequential Improvement inovalon
Revenue (M)
Growth
Operating
Leverage
Continued
Investment
&
Efficiency
$108.3
64.7%
$110.6
Q1 2017 Q2 2017 Q3 2017
Gross Margin
$17.7
66.4%
$115.9
Q1 2017 Q2 2017 Q3 2017
66.8%
Investment in Innovation
$21.9
$19.9
Q1 2017 Q2 2017 Q3 2017
Adj. EBITDA Margin²
23.0%
Q1 2017 Q2 2017
33.1%
Q1 2017
25.1%
1: Gross Margin defined as Revenue less Cost of Revenue, as a percentage of Revenue.
2: Adj. EBITDA Margin and G&A represent profit/expense as a percentage of Revenue.
INOV Q3 2017 Earnings Presentation Supplement (11.1.17) v1.0.0
G&AⓇ
32.4%
Q2 2017
26.6%
Q3 2017
4
31.3%
Q3 2017
H
(@
#
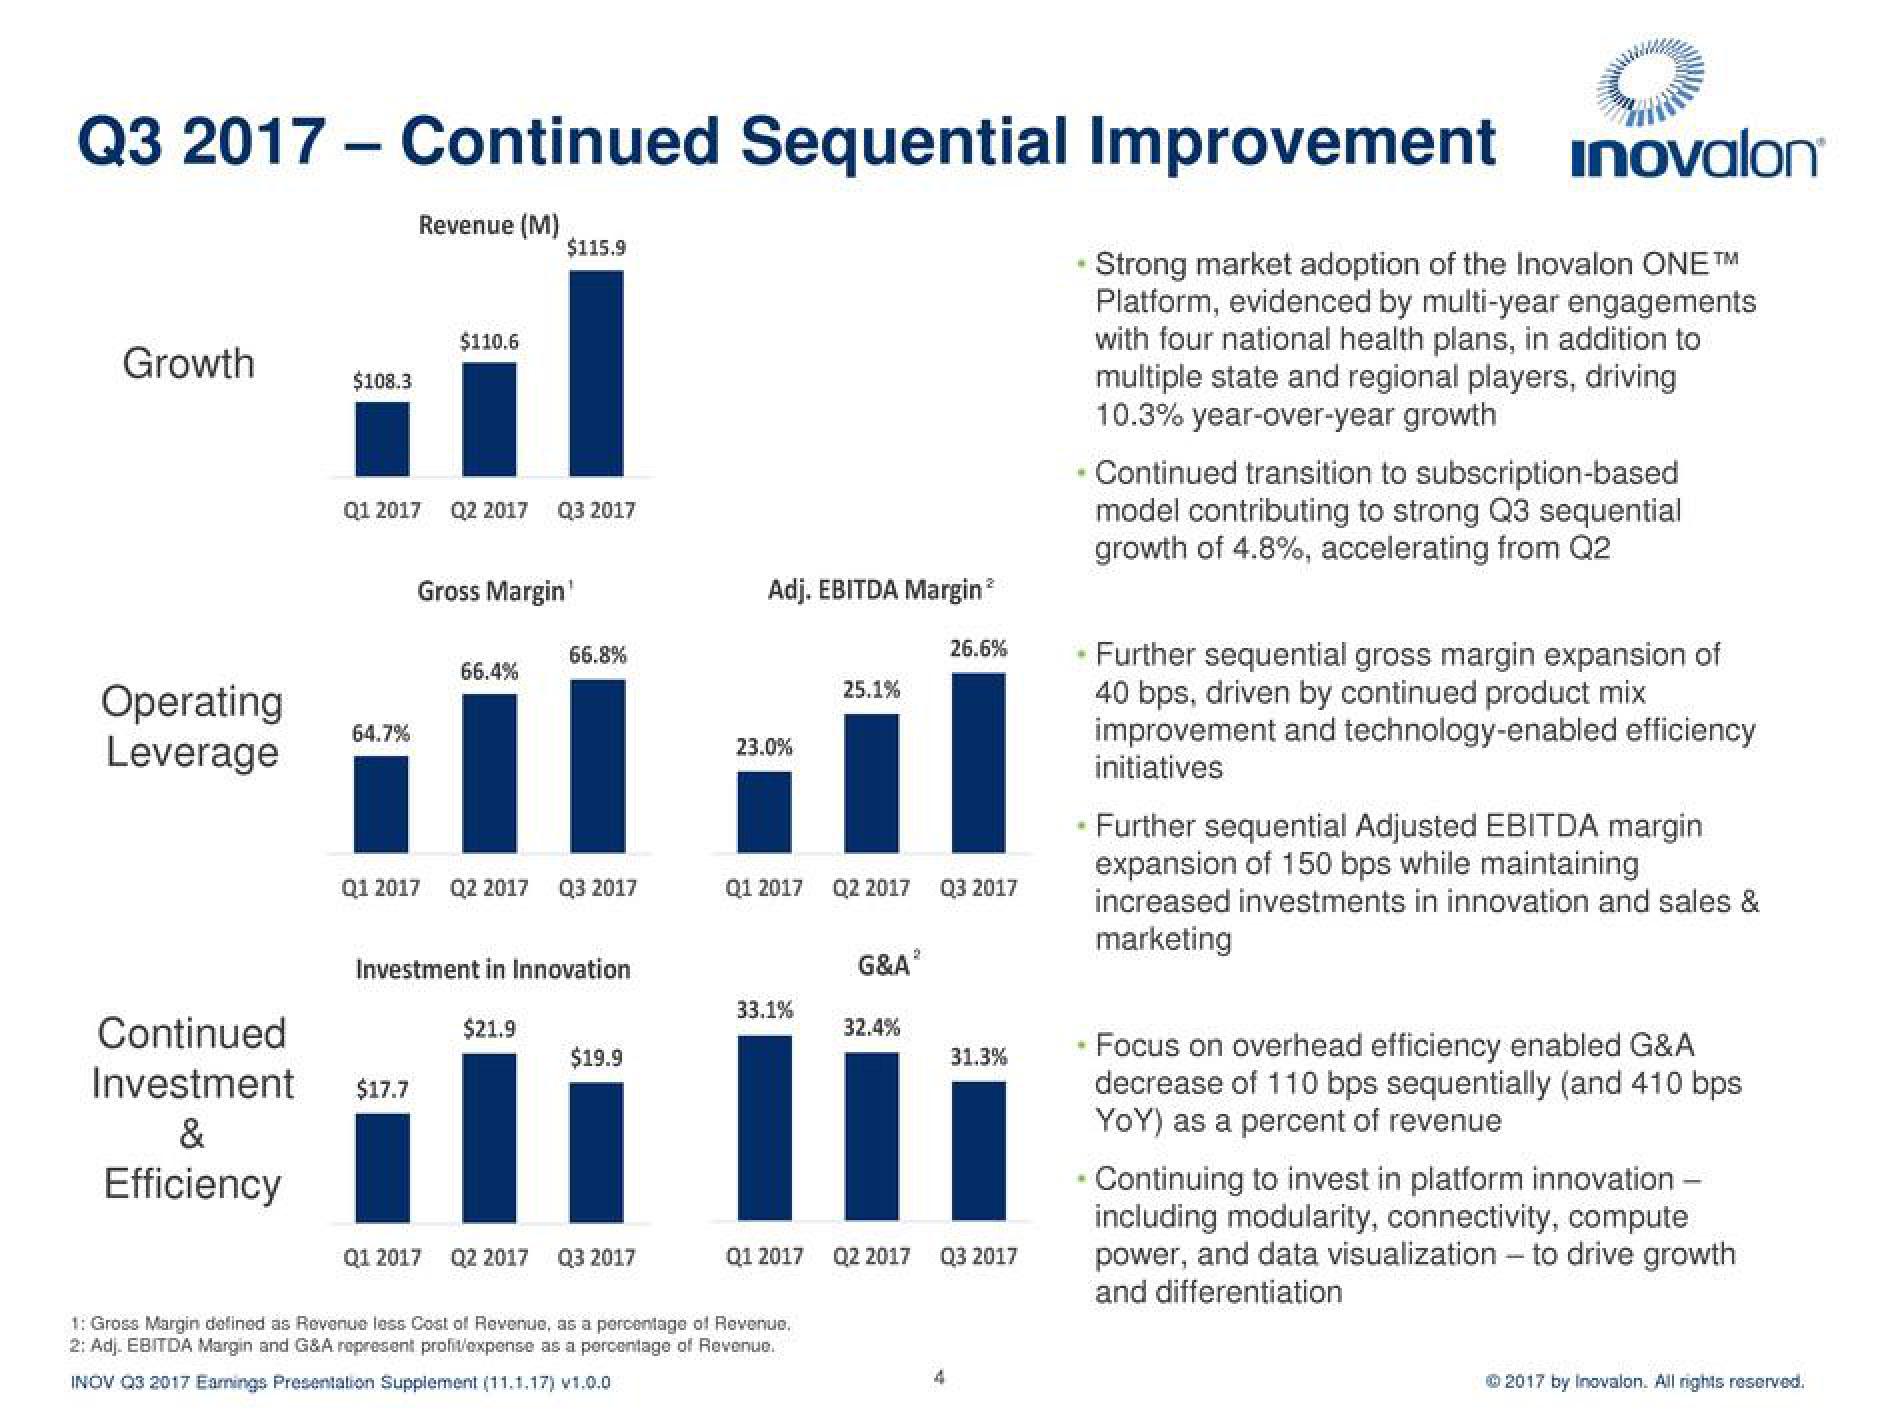
Strong market adoption of the Inovalon ONE™
Platform, evidenced by multi-year engagements
with four national health plans, in addition to
multiple state and regional players, driving
10.3% year-over-year growth
Continued transition to subscription-based
model contributing to strong Q3 sequential
growth of 4.8%, accelerating from Q2
Further sequential gross margin expansion of
40 bps, driven by continued product mix
improvement and technology-enabled efficiency
initiatives
Further sequential Adjusted EBITDA margin
expansion of 150 bps while maintaining
increased investments in innovation and sales &
marketing
Focus on overhead efficiency enabled G&A
decrease of 110 bps sequentially (and 410 bps
YoY) as a percent of revenue
Continuing to invest in platform innovation
including modularity, connectivity, compute
power, and data visualization - to drive growth
and differentiation
Ⓒ2017 by Inovalon. All rights reserved.View entire presentation