Verint SPAC Presentation Deck
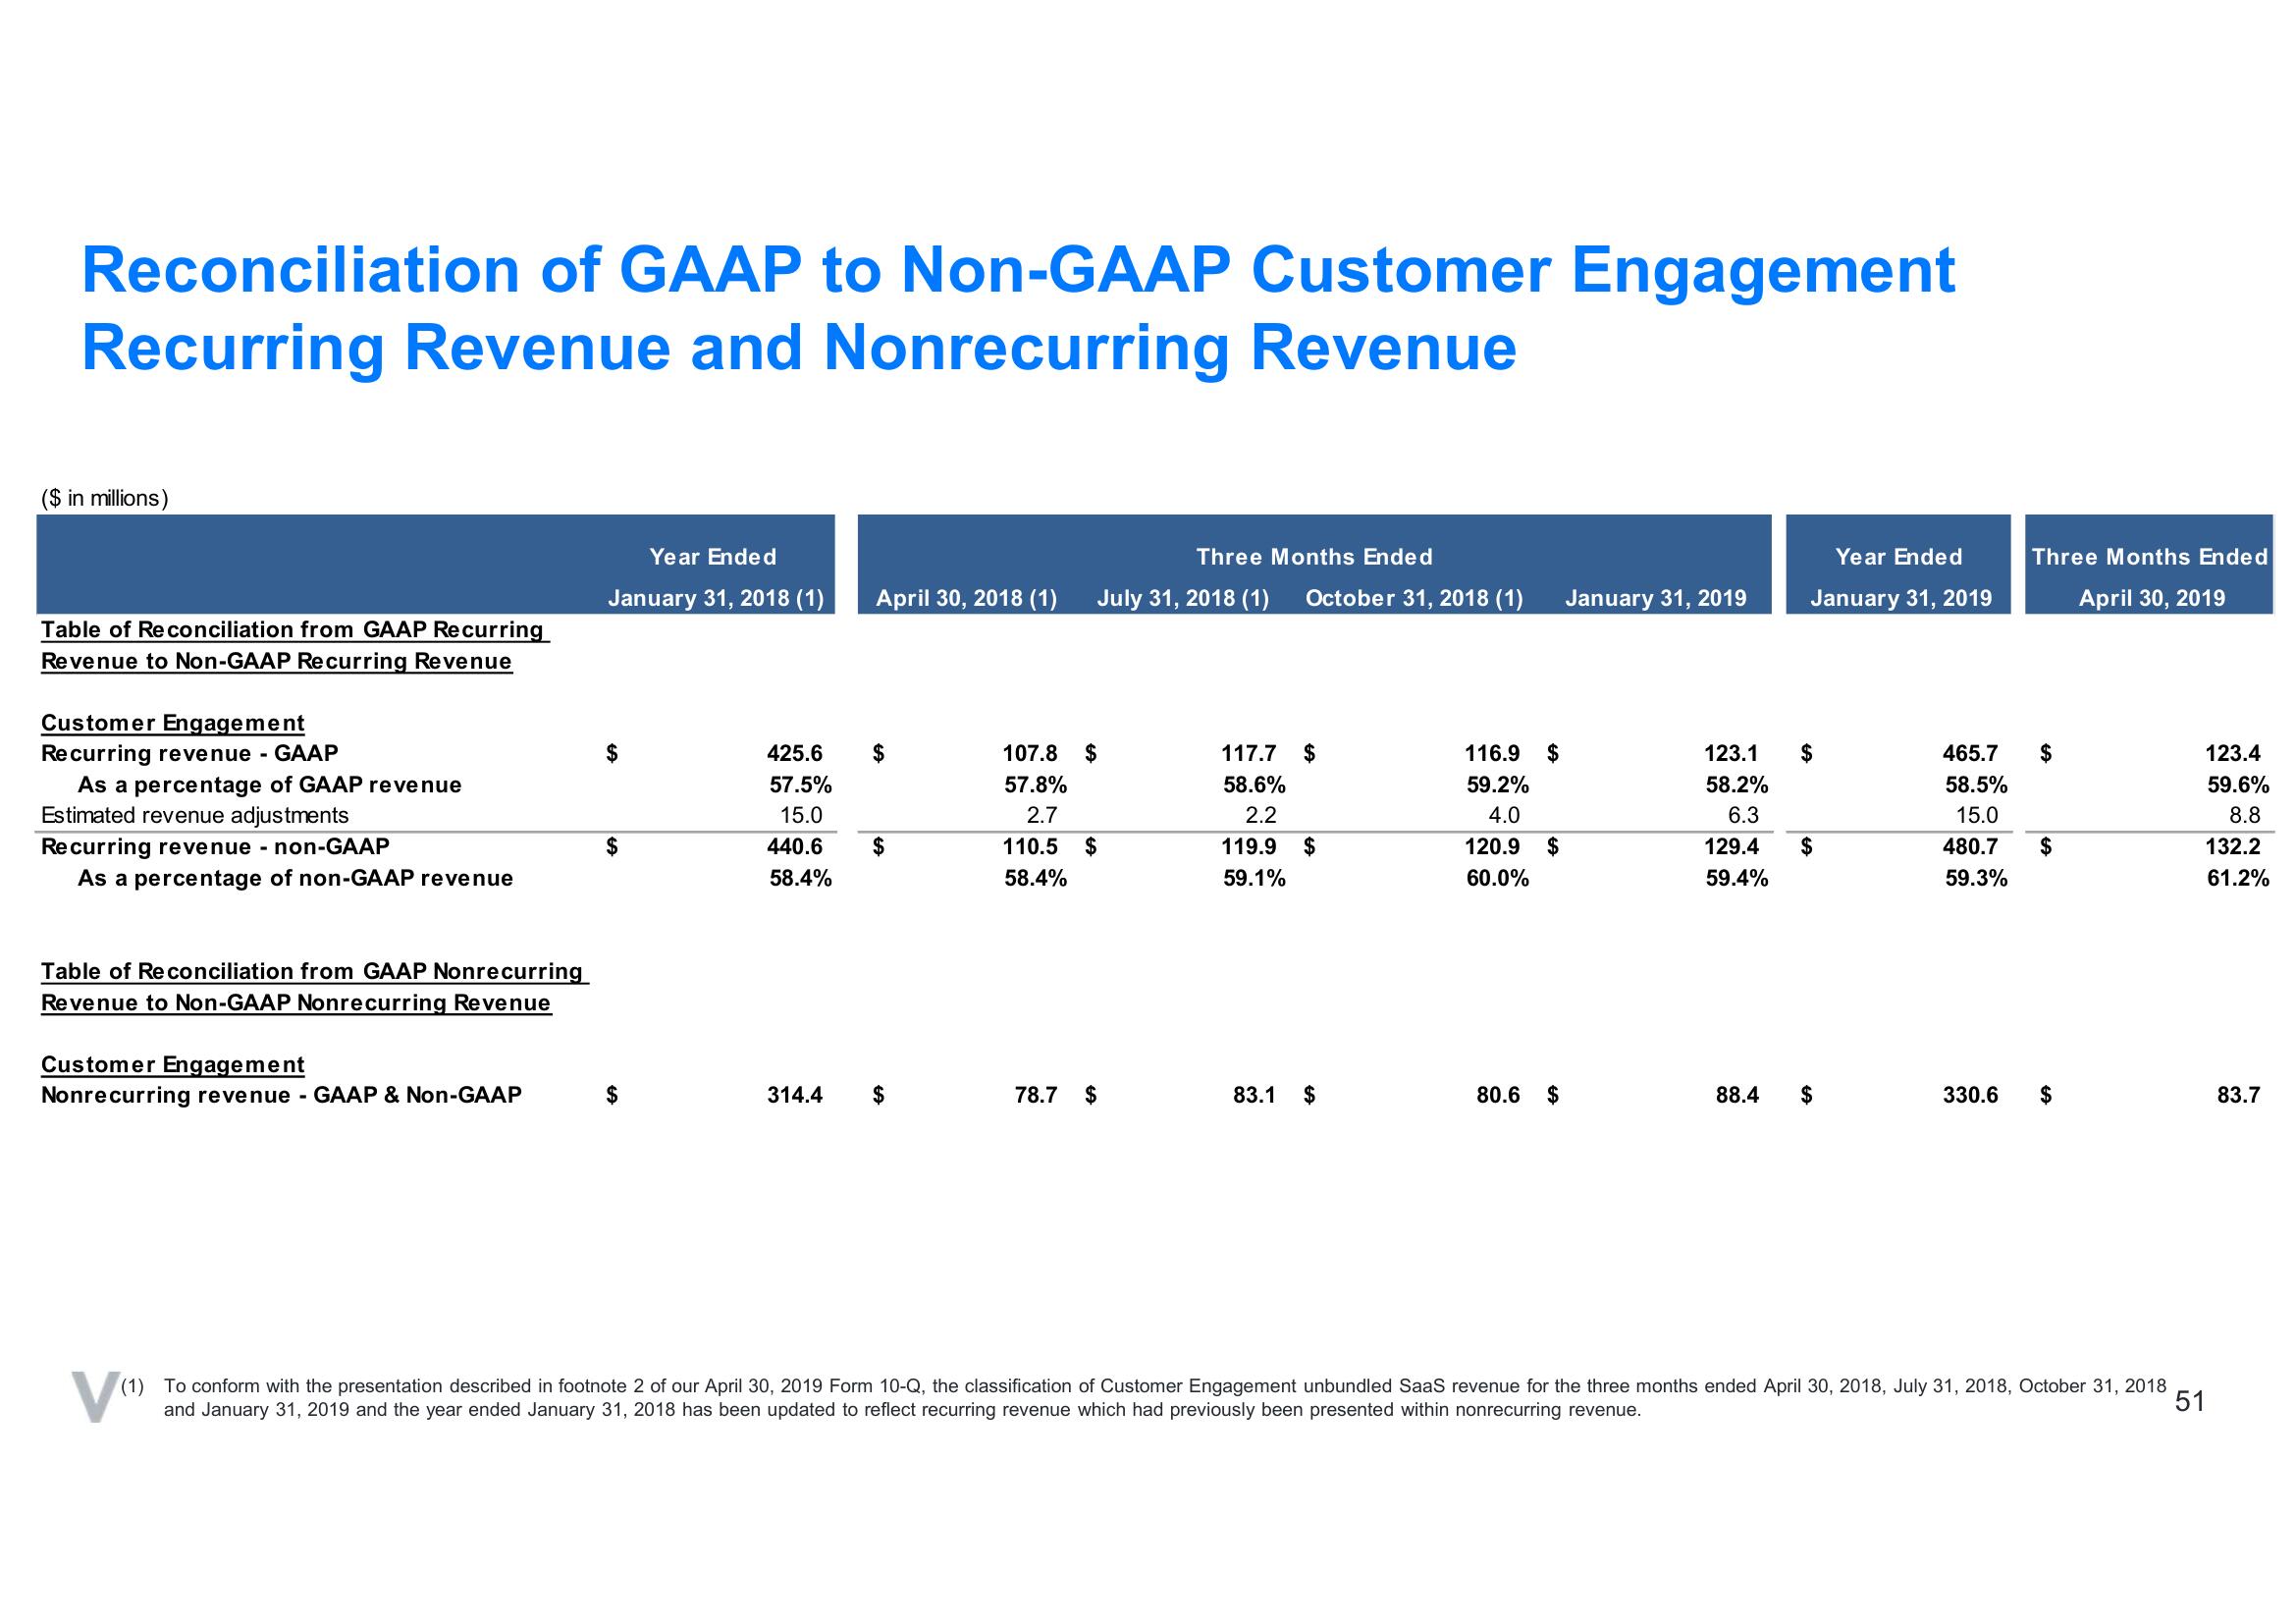
Reconciliation of GAAP to Non-GAAP Customer Engagement
Recurring Revenue and Nonrecurring Revenue
($ in millions)
Table of Reconciliation from GAAP Recurring
Revenue to Non-GAAP Recurring Revenue
Customer Engagement
Recurring revenue - GAAP
As a percentage of GAAP revenue
Estimated revenue adjustments
Recurring revenue - non-GAAP
As a percentage of non-GAAP revenue
Table of Reconciliation from GAAP Nonrecurring
Revenue to Non-GAAP Nonrecurring Revenue
Customer Engagement
Nonrecurring revenue - GAAP & Non-GAAP
Year Ended
January 31, 2018 (1)
$
$
425.6
57.5%
15.0
440.6
58.4%
314.4
April 30, 2018 (1)
$
$
$
107.8
57.8%
2.7
110.5
58.4%
Three Months Ended
July 31, 2018 (1) October 31, 2018 (1)
$
$
78.7 $
117.7 $
58.6%
2.2
119.9
59.1%
$
83.1 $
116.9
59.2%
4.0
120.9
60.0%
$
$
80.6 $
January 31, 2019
123.1
58.2%
6.3
129.4
59.4%
88.4
Year Ended
January 31, 2019
$
Three Months Ended
April 30, 2019
$
465.7
58.5%
15.0
480.7 $
59.3%
330.6 $
V₁₁
(1) To conform with the presentation described in footnote 2 of our April 30, 2019 Form 10-Q, the classification of Customer Engagement unbundled SaaS revenue for the three months ended April 30, 2018, July 31, 2018, October 31, 2018
and January 31, 2019 and the year ended January 31, 2018 has been updated to reflect recurring revenue which had previously been presented within nonrecurring revenue.
51
123.4
59.6%
8.8
132.2
61.2%
83.7View entire presentation