Bridge Investment Group Results Presentation Deck
PERFORMANCE FEE SUMMARY
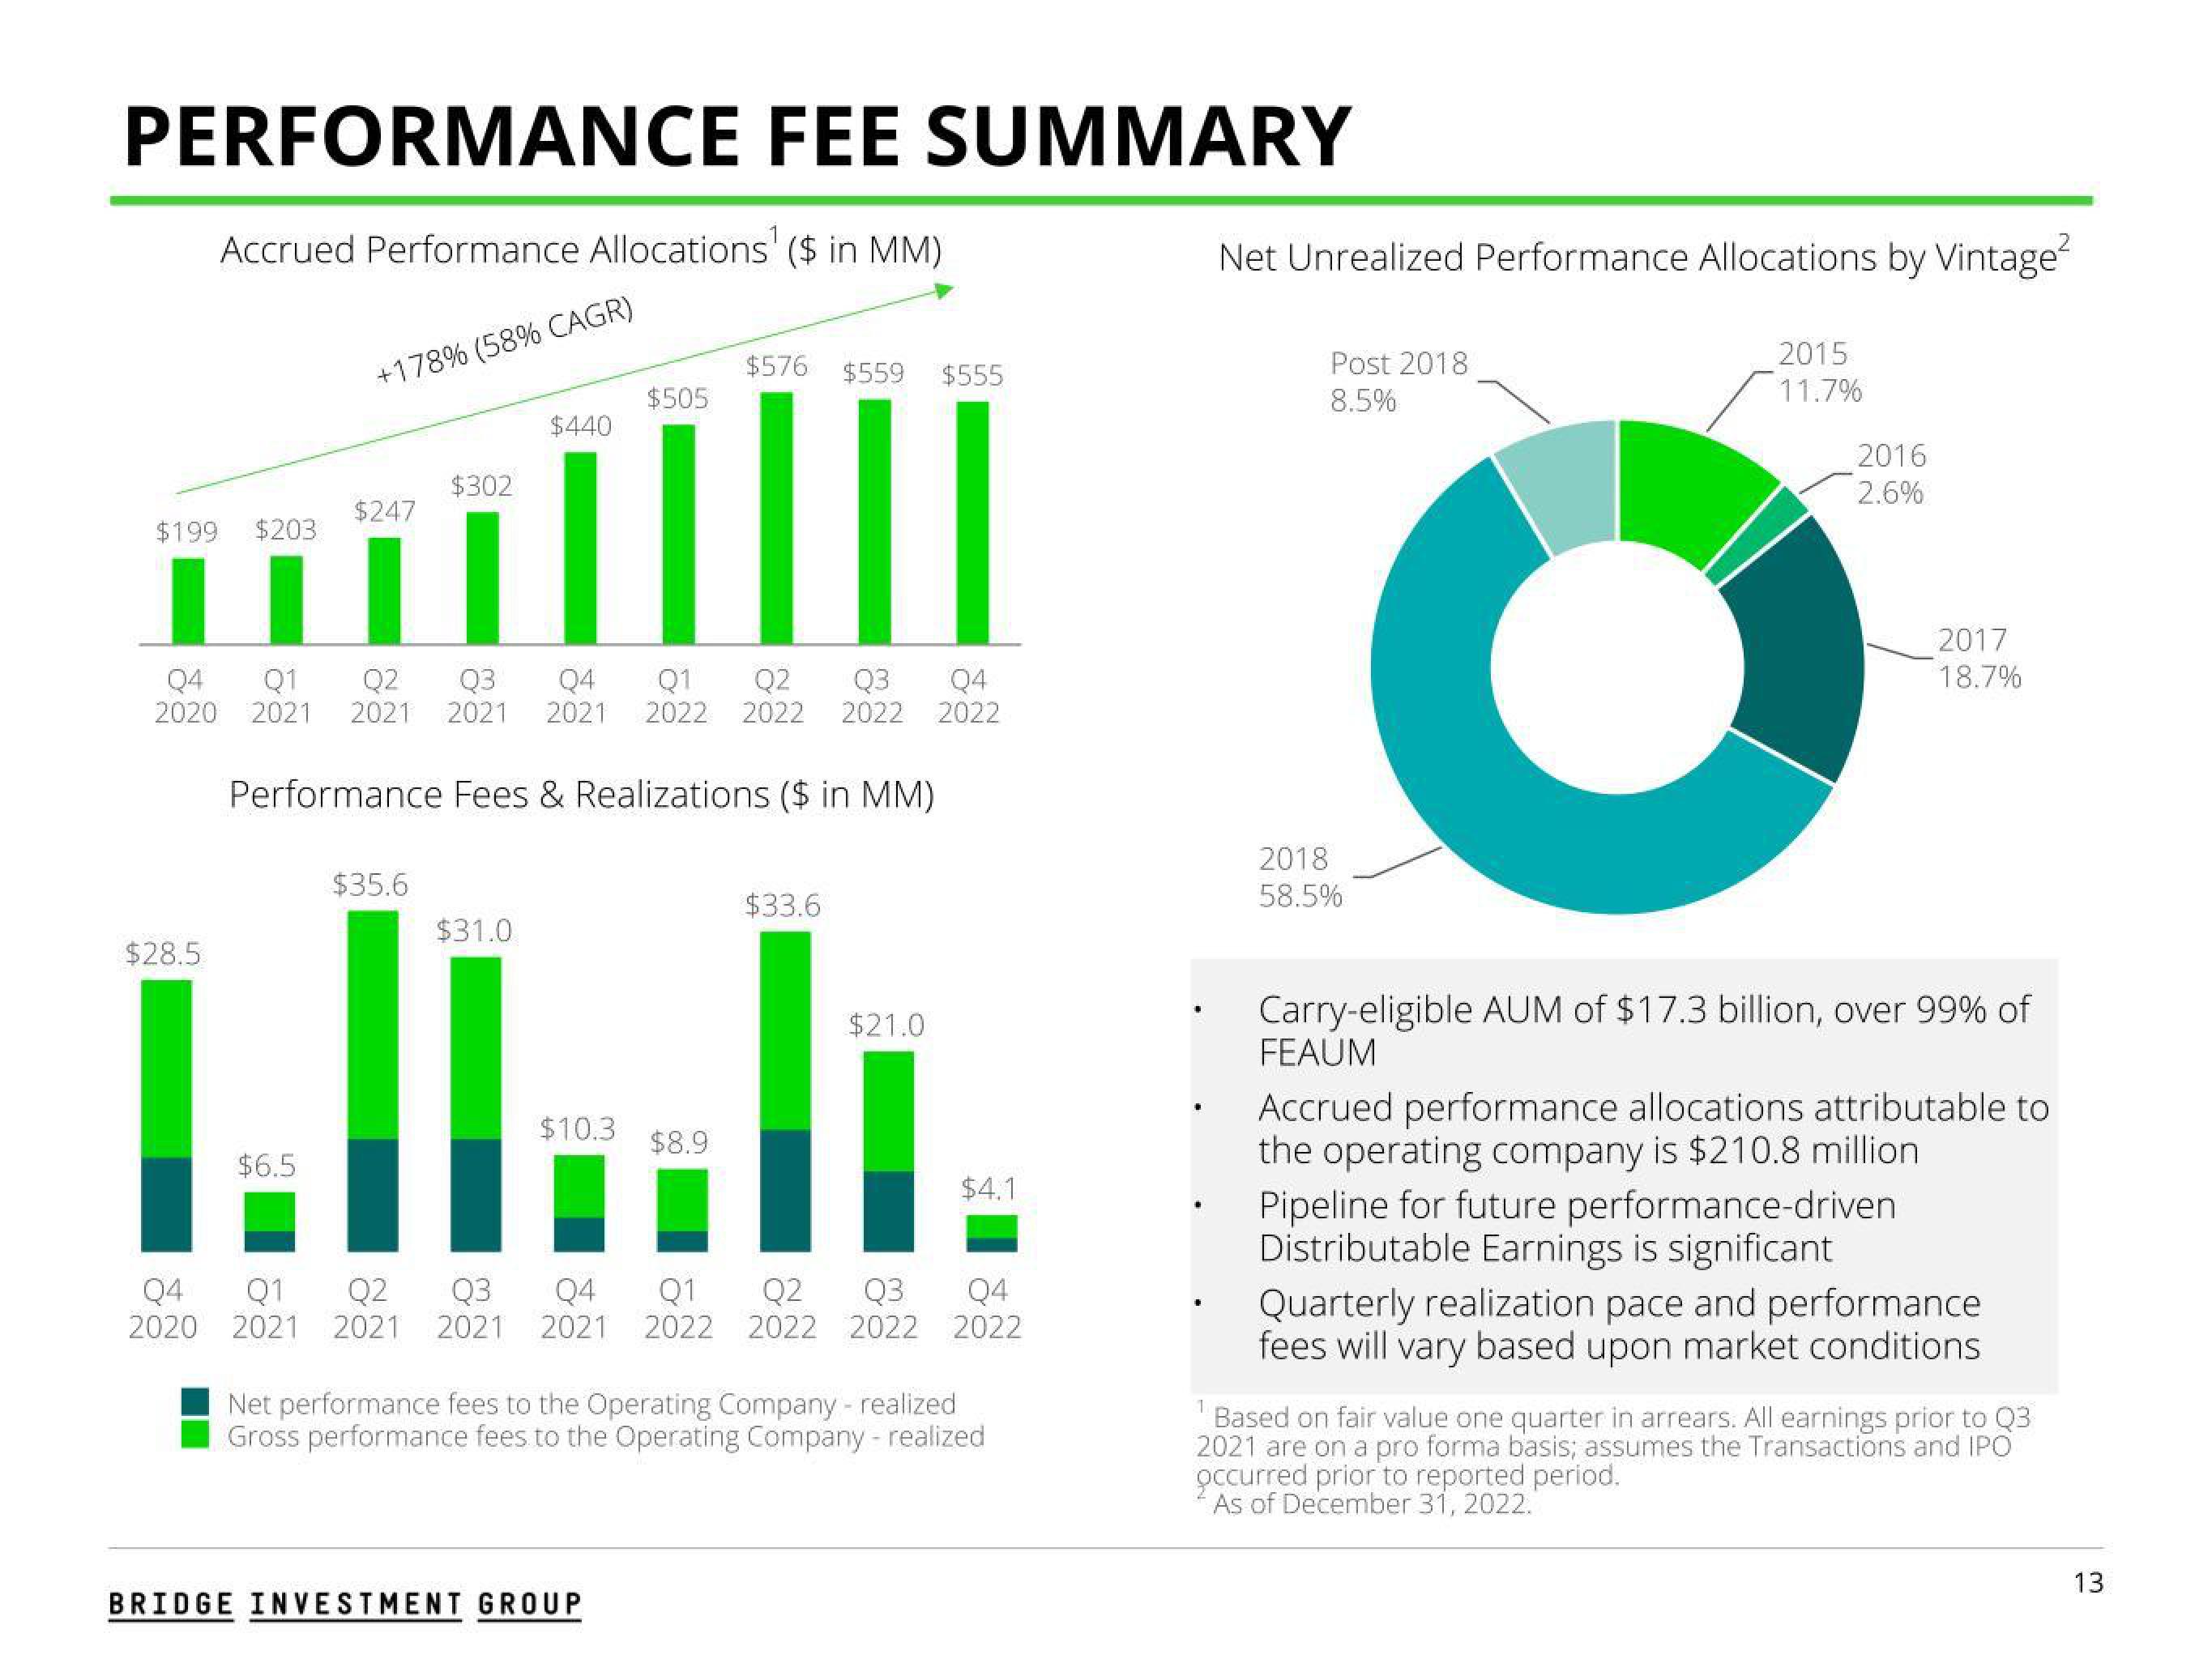
Accrued Performance Allocations ($ in MM)
$199 $203
$28.5
+178% (58% CAGR)
$6.5
$247
$302
$35.6
$440
Q4 Q1 Q2 Q3 Q4 Q1 Q2 Q3 Q4
2020 2021 2021 2021 2021 2022 2022 2022 2022
Performance Fees & Realizations ($ in MM)
$31.0
$505
$10.3 $8.9
$576
BRIDGE INVESTMENT GROUP
$559 $555
$33.6
$21.0
Q1 Q2 Q3 Q4 Q1 Q2 Q3
Q4
2020 2021 2021 2021 2021 2022 2022 2022
$4.1
Q4
2022
Net performance fees to the Operating Company - realized
Gross performance fees to the Operating Company - realized
Net Unrealized Performance Allocations by Vintage²
Post 2018
8.5%
2018
58.5%
2015
11.7%
2016
2.6%
2017
18.7%
Carry-eligible AUM of $17.3 billion, over 99% of
FEAUM
Accrued performance allocations attributable to
the operating company is $210.8 million
Pipeline for future performance-driven
Distributable Earnings is significant
Quarterly realization pace and performance
fees will vary based upon market conditions
1
Based on fair value one quarter in arrears. All earnings prior to Q3
2021 are on a pro forma basis; assumes the Transactions and IPO
occurred prior to reported period.
As of December 31, 2022.
13View entire presentation