Shoals Results Presentation Deck
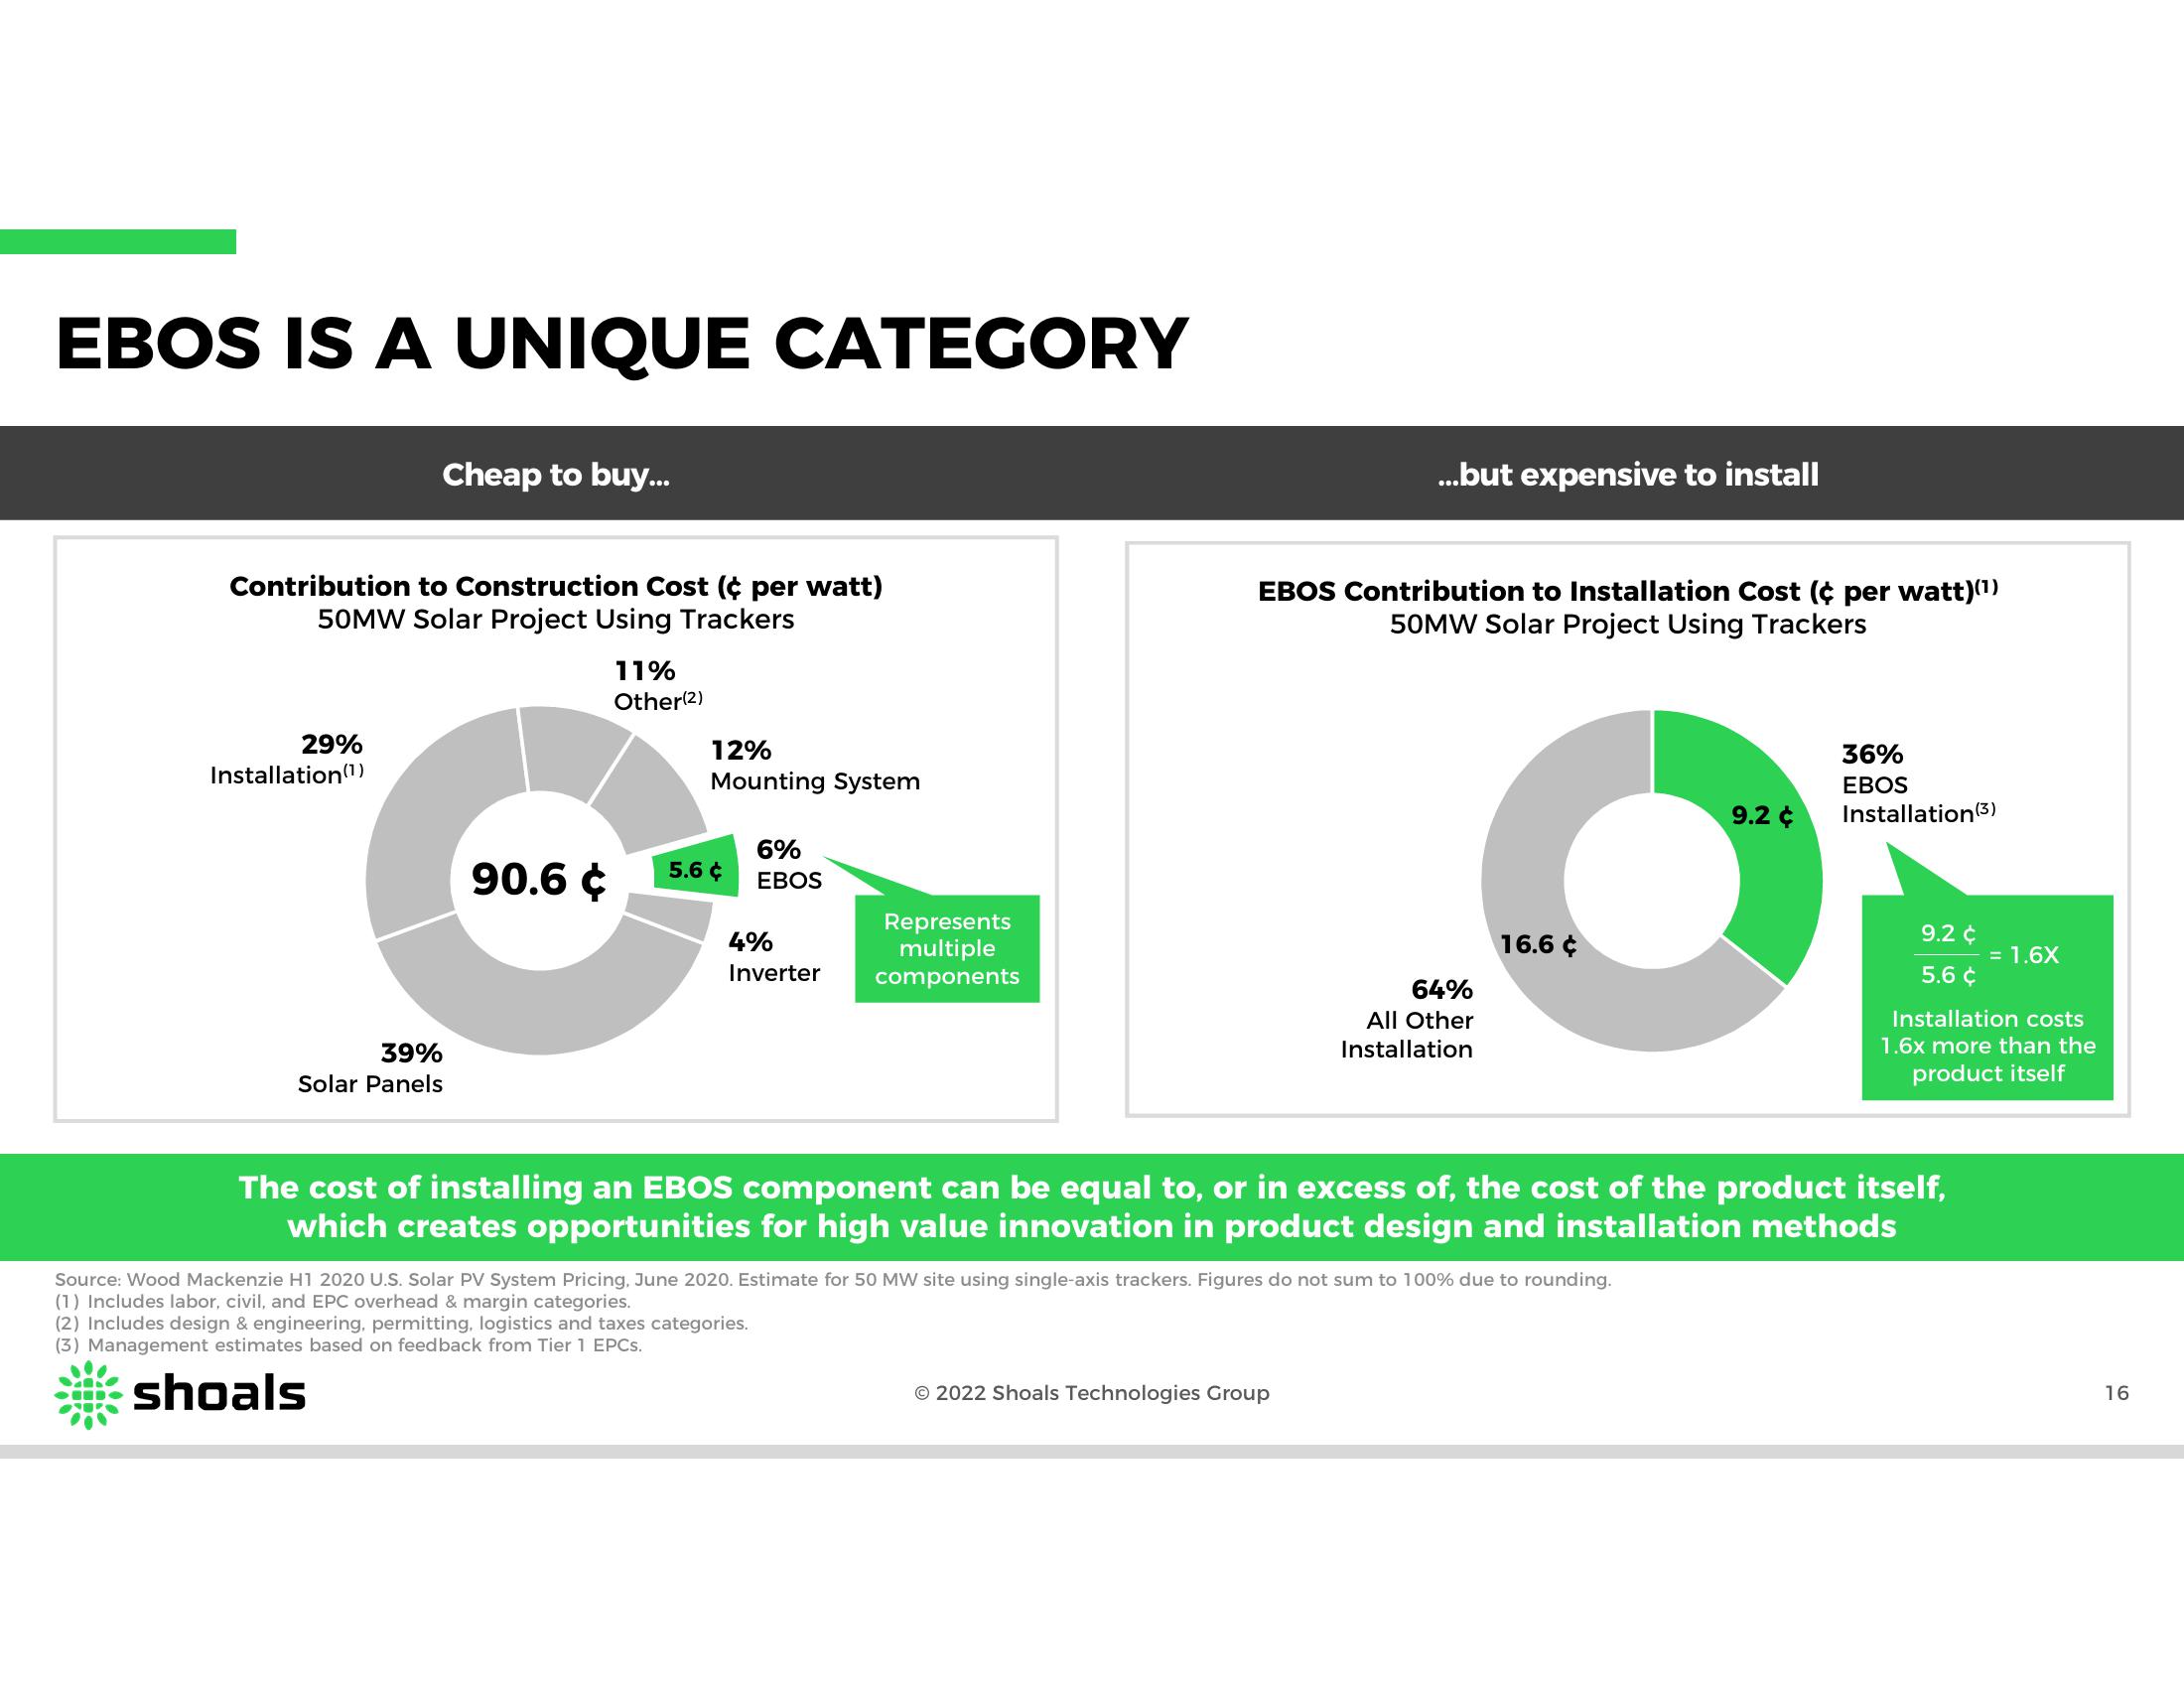
EBOS IS A UNIQUE CATEGORY
Cheap to buy...
Contribution to Construction Cost ( per watt)
50MW Solar Project Using Trackers
29%
Installation (¹)
39%
Solar Panels
90.6
11%
Other(2)
12%
Mounting System
5.6 ¢
6%
EBOS
4%
Inverter
Represents
multiple
components
...but expensive to install
EBOS Contribution to Installation Cost ( per watt)(¹)
50MW Solar Project Using Trackers
64%
All Other
Installation
© 2022 Shoals Technologies Group
9.2 ¢
O
16.6 ¢
Source: Wood Mackenzie H1 2020 U.S. Solar PV System Pricing, June 2020. Estimate for 50 MW site using single-axis trackers. Figures do not sum to 100% due to rounding.
(1) Includes labor, civil, and EPC overhead & margin categories.
(2) Includes design & engineering, permitting, logistics and taxes categories.
(3) Management estimates based on feedback from Tier 1 EPCs.
shoals
36%
EBOS
Installation (3)
9.2 ¢
5.6 ¢
The cost of installing an EBOS component can be equal to, or in excess of, the cost of the product itself,
which creates opportunities for high value innovation in product design and installation methods
= 1.6X
Installation costs
1.6x more than the
product itself
16View entire presentation