J.P.Morgan 2Q23 Investor Results
JPMORGAN CHASE & CO.
CONSUMER & COMMUNITY BANKING
FINANCIAL HIGHLIGHTS, CONTINUED
(in millions, except headcount data)
SELECTED BALANCE SHEET DATA (period-end)
Total assets
Loans:
Banking & Wealth Management (a)
Home Lending (b)
Card Services
Auto
Total loans
Deposits
Equity
SELECTED BALANCE SHEET DATA (average)
Total assets
Loans:
Banking & Wealth Management
Home Lending (c)
Card Services
Auto
Total loans
Deposits
Equity
Headcount
2Q23
$ 620,193
$
30,959 (d)
262,432 (d)
191,353
73,587
558,331
576,417
30,628 (f)
229,569 (f)
187,028
71,083
518,308
1,173,514 (e) 1,147,474
55,500
52,000
1,157,309
54,346
1Q23
137,087
$ 506,382
28,038
172,058
180,079
69,556
449,731
$ 506,775
28,504
172,124
180,451
68,744
449,823
1,112,967
52,000
135,983
4Q22
QUARTERLY TRENDS
$ 514,085
29,008
172,554
185,175
68,191
454,928
1,131,611
50,000
$ 504,859
29,412
174,487
177,026
67,623
448,548
1,142,523
50,000
135,347
$
3Q22
500,752
30,230
174,618
170,462
67,201
442,511
1,173,241
50,000
$ 498,858
30,788
176,852
168,125
66,979
442,744
1,174,227
50,000
133,803
$
2Q22
500,219
31,494
176,939
165,494
67,842
441,769
1,178,825
50,000
$ 496,177
32,294
177,330
158,434
68,569
436,627
1,180,453
50,000
130,907
2Q23 Change
1Q23
22 %
10
53
6
6
24
2
7
14
7
33
4
3
15
4
5
1
JPMORGAN CHASE & Co.
2Q22
24%
(2)
48
16
8
26
11
16
(5)
29
18
4
19
(2)
9
5
2023
SIX MONTHS ENDED JUNE 30,
$ 620,193
30,959 (d)
262,432 (d)
191,353
73,587
558,331
1,173,514 (e)
55,500
$ 541,788
29,572 (f)
201,005 (f)
183,758
69,920
484,255
1,135,261
53,180
137,087
2022
$ 500,219
$
31,494
176,939
165,494
67,842
441,769
1,178,825
50,000
492,592
33,014
176,911
153,941
68,908
432,774
1,167,057
50,000
130,907
2023 Change
2022
24 %
(2)
48
16
8
26
11
10
(10)
14
19
1
12
(3)
6
5
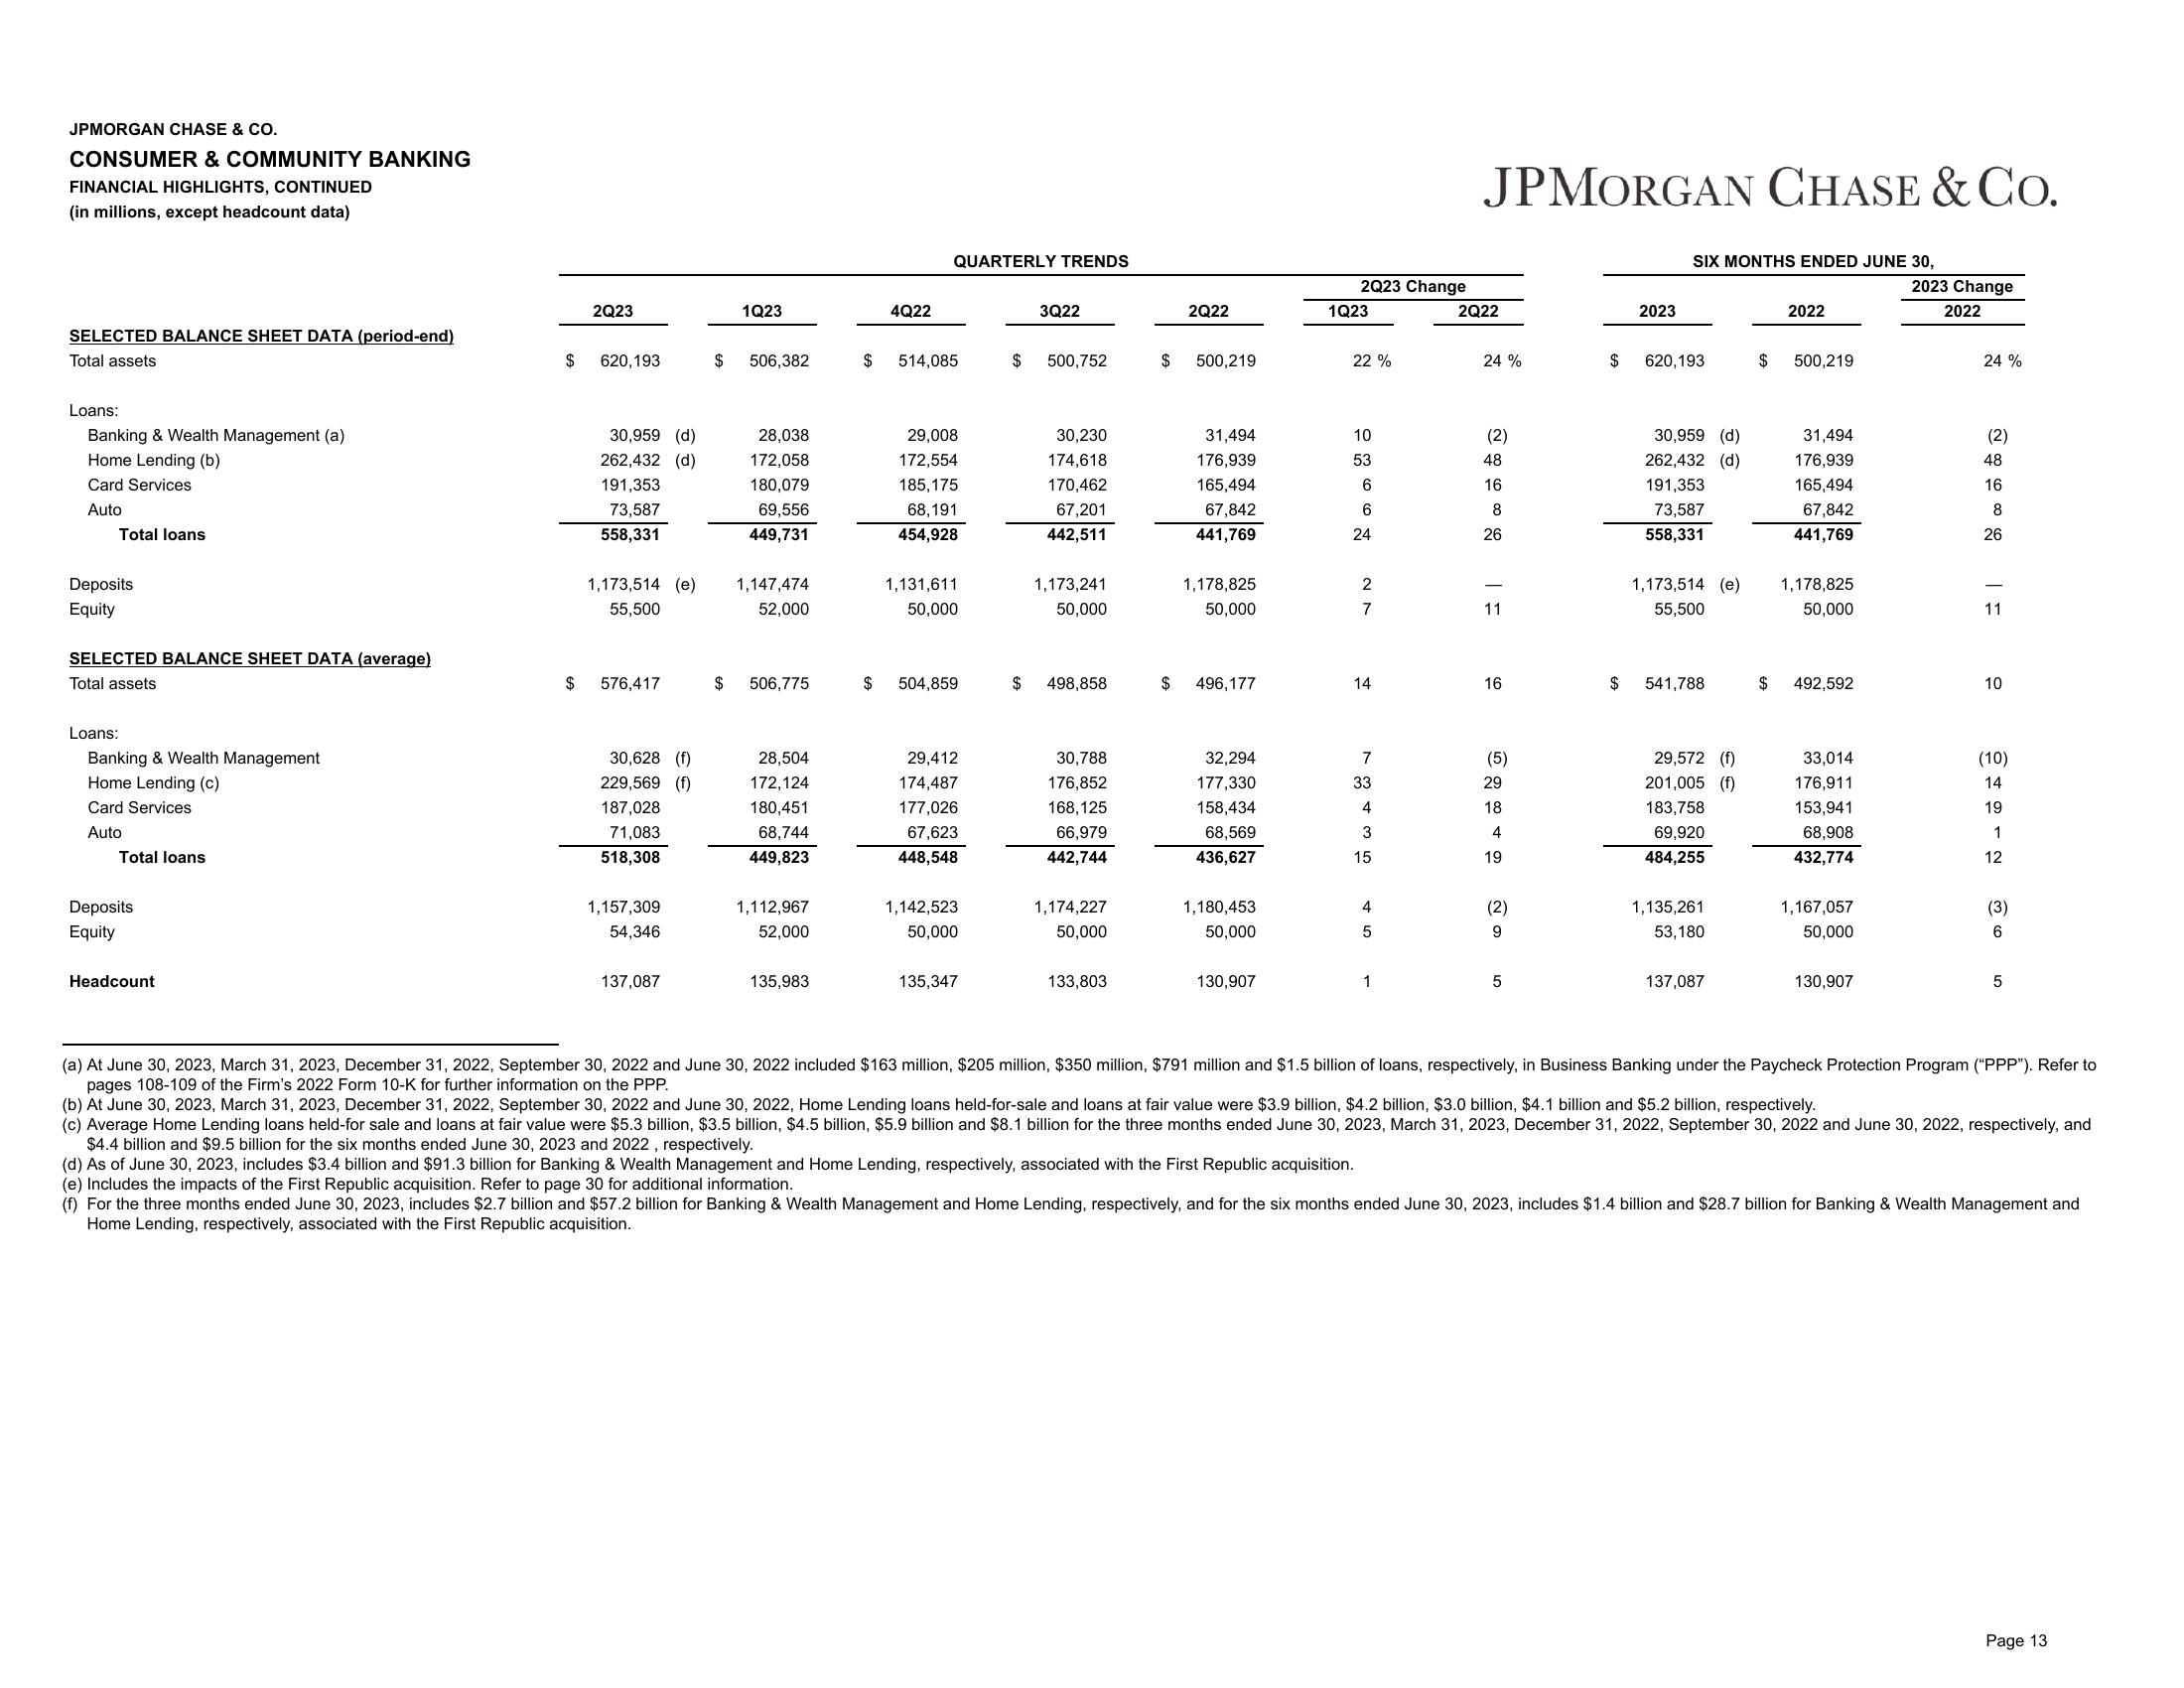
(a) At June 30, 2023, March 31, 2023, December 31, 2022, September 30, 2022 and June 30, 2022 included $163 million, $205 million, $350 million, $791 million and $1.5 billion of loans, respectively, in Business Banking under the Paycheck Protection Program ("PPP"). Refer to
pages 108-109 of the Firm's 2022 Form 10-K for further information on the PPP.
(b) At June 30, 2023, March 31, 2023, December 31, 2022, September 30, 2022 and June 30, 2022, Home Lending loans held-for-sale and loans at fair value were $3.9 billion, $4.2 billion, $3.0 billion, $4.1 billion and $5.2 billion, respectively.
(c) Average Home Lending loans held-for sale and loans at fair value were $5.3 billion, $3.5 billion, $4.5 billion, $5.9 billion and $8.1 billion for the three months ended June 30, 2023, March 31, 2023, December 31, 2022, September 30, 2022 and June 30, 2022, respectively, and
$4.4 billion and $9.5 billion for the six months ended June 30, 2023 and 2022, respectively.
(d) As of June 30, 2023, includes $3.4 billion and $91.3 billion for Banking & Wealth Management and Home Lending, respectively, associated with the First Republic acquisition.
(e) Includes the impacts of the First Republic acquisition. Refer to page 30 for additional information.
(f) For the three months ended June 30, 2023, includes $2.7 billion and $57.2 billion for Banking & Wealth Management and Home Lending, respectively, and for the six months ended June 30, 2023, includes $1.4 billion and $28.7 billion for Banking & Wealth Management and
Home Lending, respectively, associated with the First Republic acquisition.
Page 13View entire presentation