Nerdy Investor Presentation Deck
1.
2.
3.
TPG Pace Forecast¹
$ in Millions
Active Learners²
% Active Learners YoY
Online Revenue
% YoY Growth
Total Revenue
% YoY Growth
Gross Profit
% Margin
(-) Sales & Marketing Expense
(-) Operations & Fulfillment
(-) Tech & Product
(-) G&A
Total Opex
Net Income
% Margin
Adjusted EBITDA³
% Margin
$
$
$
$
$
2018
47
42 $
72 $
46 $
63%
(30)
(14)
(9)
(18)
(41)
(25) $
(35%)
(21) $
(29%)
2019
63
34%
64 $
54%
90 $
26%
60 $
66%
(38)
(15)
(10)
(18)
(42)
(22) $
(25%)
(14) $
(15%)
2020
87
37%
97 $
51%
104 $
15%
69
66%
(44)
(14)
(12)
(18)
(43)
(25) $
(24%)
(9) $
(9%)
2021F
130
50%
138 $
42%
138 $
33%
96
70%
(57)
(14)
(17)
(25)
(56)
(11) $
(8%)
(8) $
(5%)
2022F
199
53%
198 $
43%
198 $
43%
141
71%
(84)
(20)
(27)
(24)
(71)
(14) $
(7%)
(3) $
(2%)
2023F
284
43%
267
35%
267
35%
193
72%
(109)
(26)
(31)
(25)
(82)
1
1%
14
5%
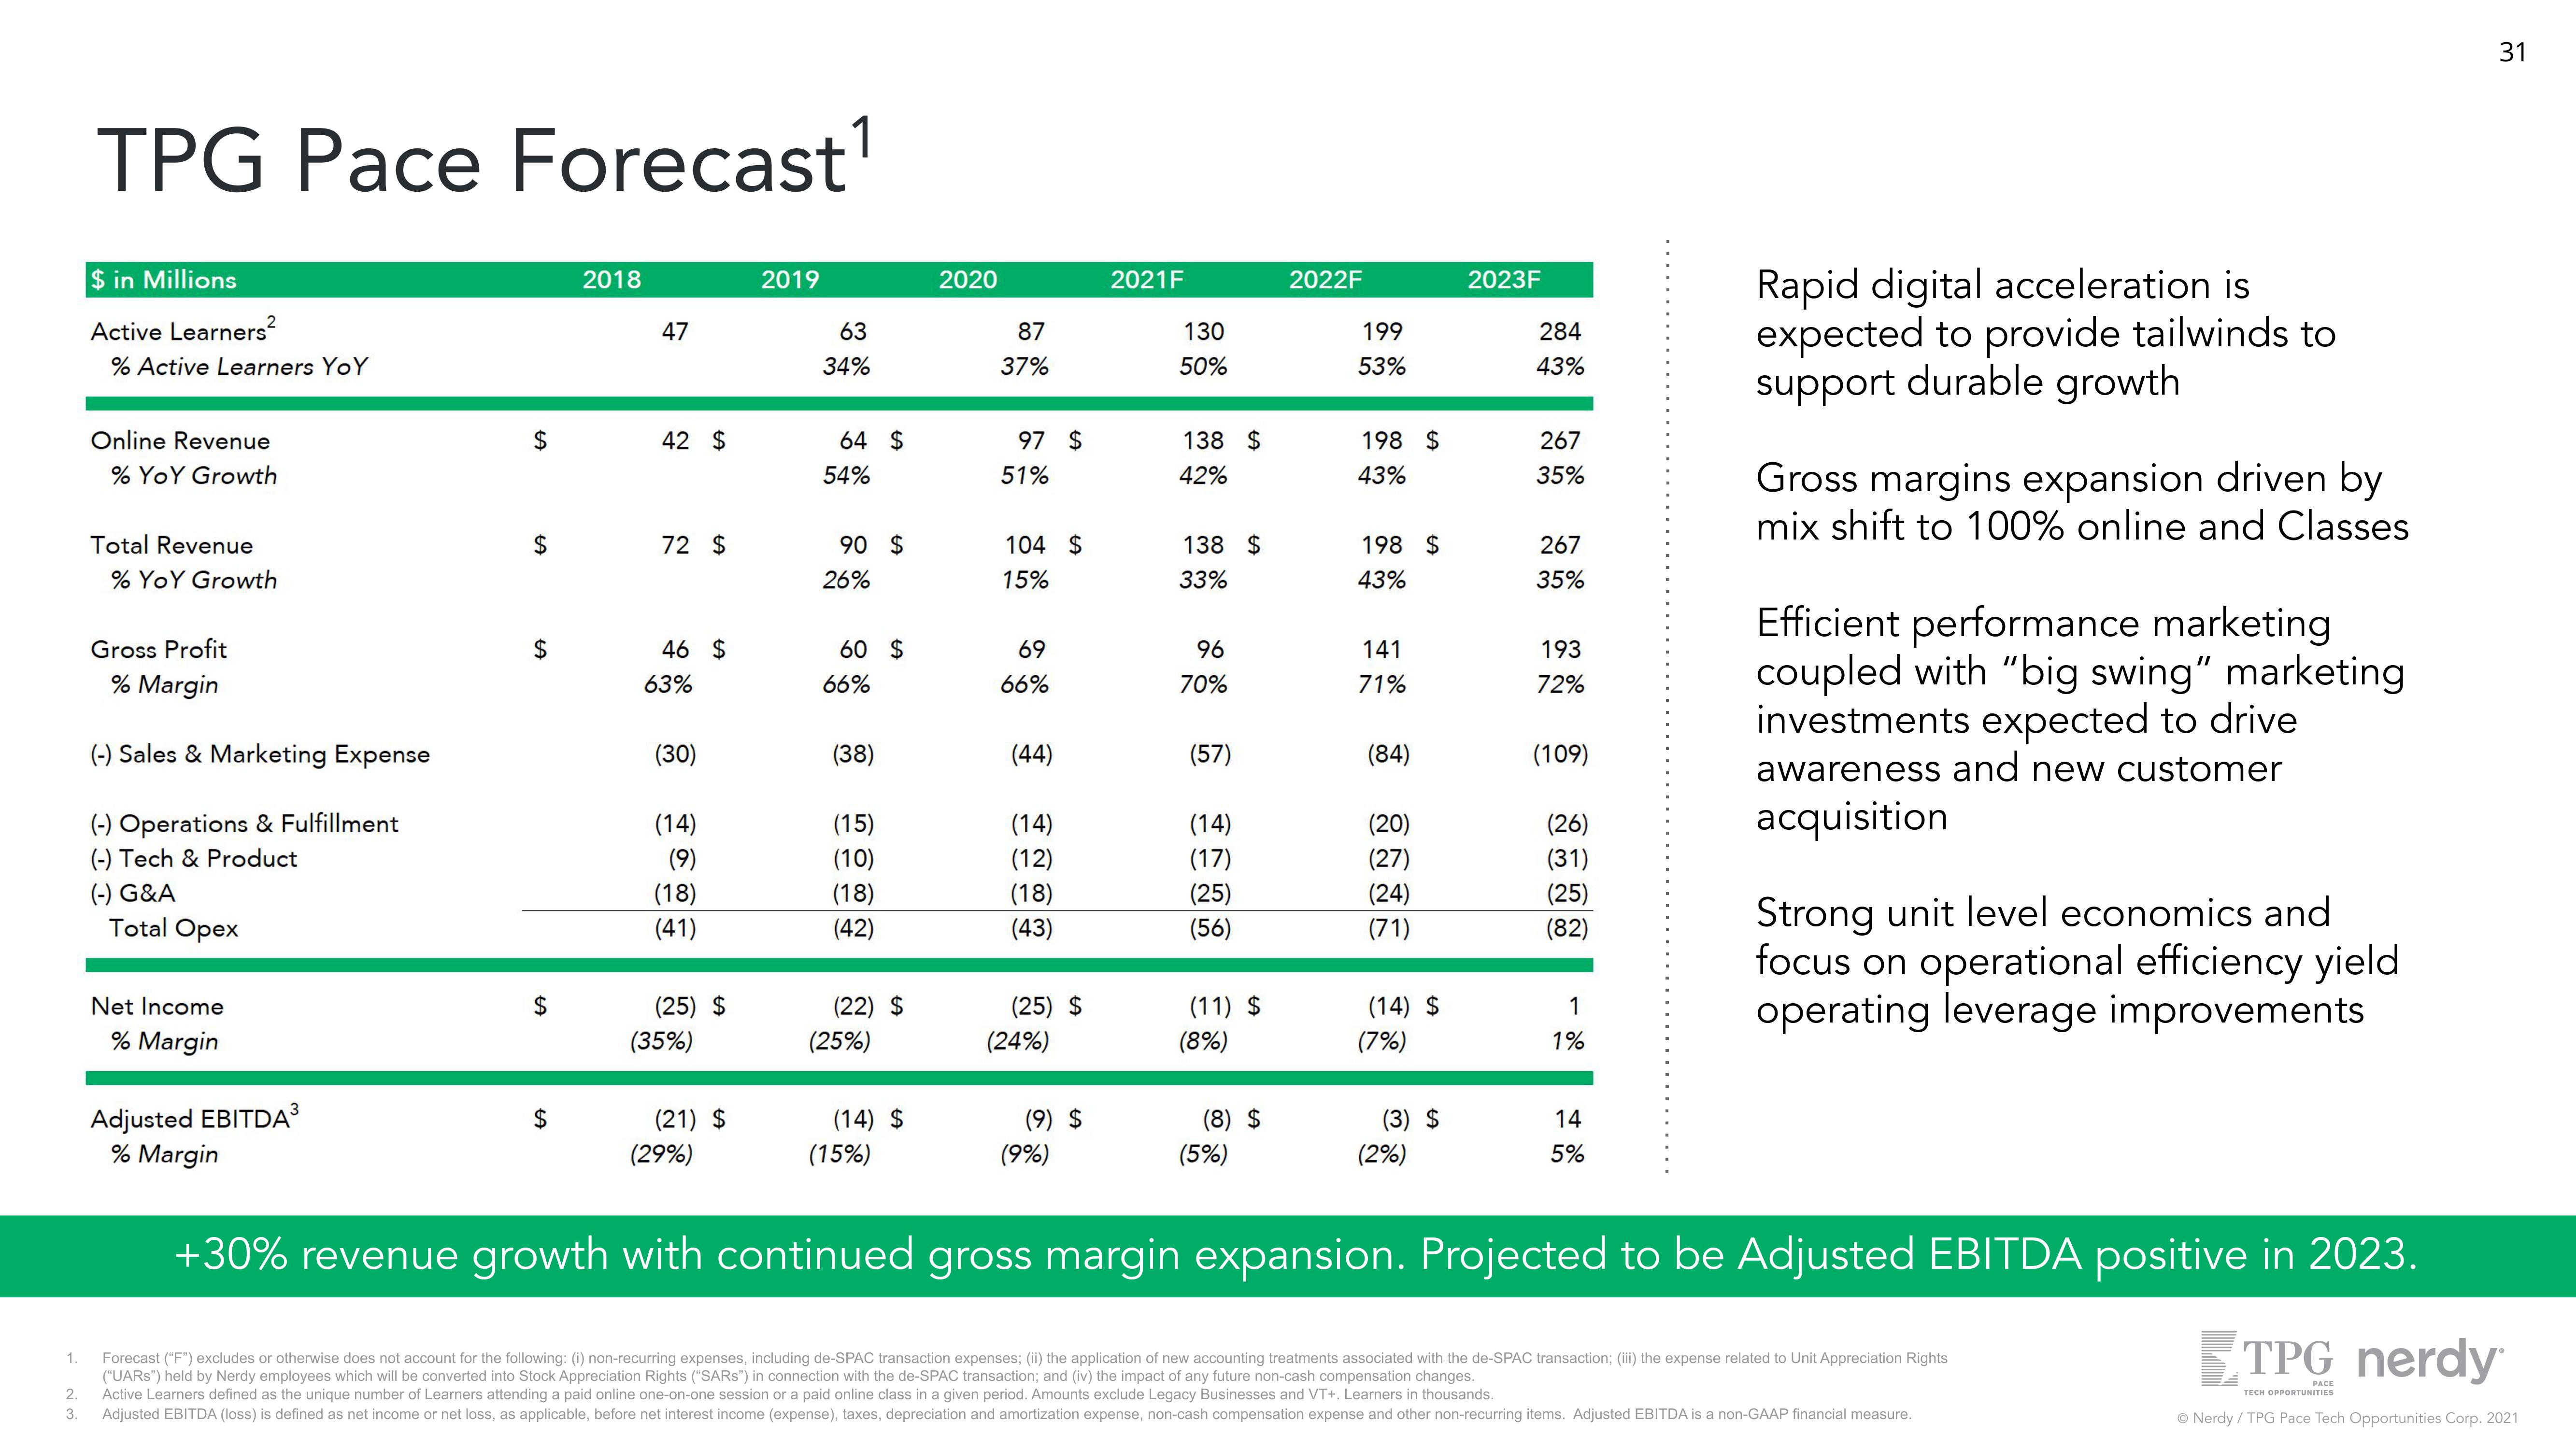
Rapid digital acceleration is
expected to provide tailwinds to
support durable growth
Gross margins expansion driven by
mix shift to 100% online and Classes
Efficient performance marketing
coupled with "big swing" marketing
investments expected to drive
awareness and new customer
acquisition
Strong unit level economics and
focus on operational efficiency yield
operating leverage improvements
31
+30% revenue growth with continued gross margin expansion. Projected to be Adjusted EBITDA positive in 2023.
TPG nerdy
PACE
TECH OPPORTUNITIES
Ⓒ Nerdy / TPG Pace Tech Opportunities Corp. 2021
Forecast ("F") excludes or otherwise does not account for the following: (i) non-recurring expenses, including de-SPAC transaction expenses; (ii) the application of new accounting treatments associated with the de-SPAC transaction; (iii) the expense related to Unit Appreciation Rights
("UARS") held by Nerdy employees which will be converted into Stock Appreciation Rights ("SARS") in connection with the de-SPAC transaction; and (iv) the impact of any future non-cash compensation changes.
Active Learners defined as the unique number of Learners attending a paid online one-on-one session or a paid online class in a given period. Amounts exclude Legacy Businesses and VT+, Learners in thousands.
Adjusted EBITDA (loss) is defined as net income or net loss, as applicable, before net interest income (expense), taxes, depreciation and amortization expense, non-cash compensation expense and other non-recurring items. Adjusted EBITDA is a non-GAAP financial measure.View entire presentation