Grindr Investor Presentation Deck
19
5
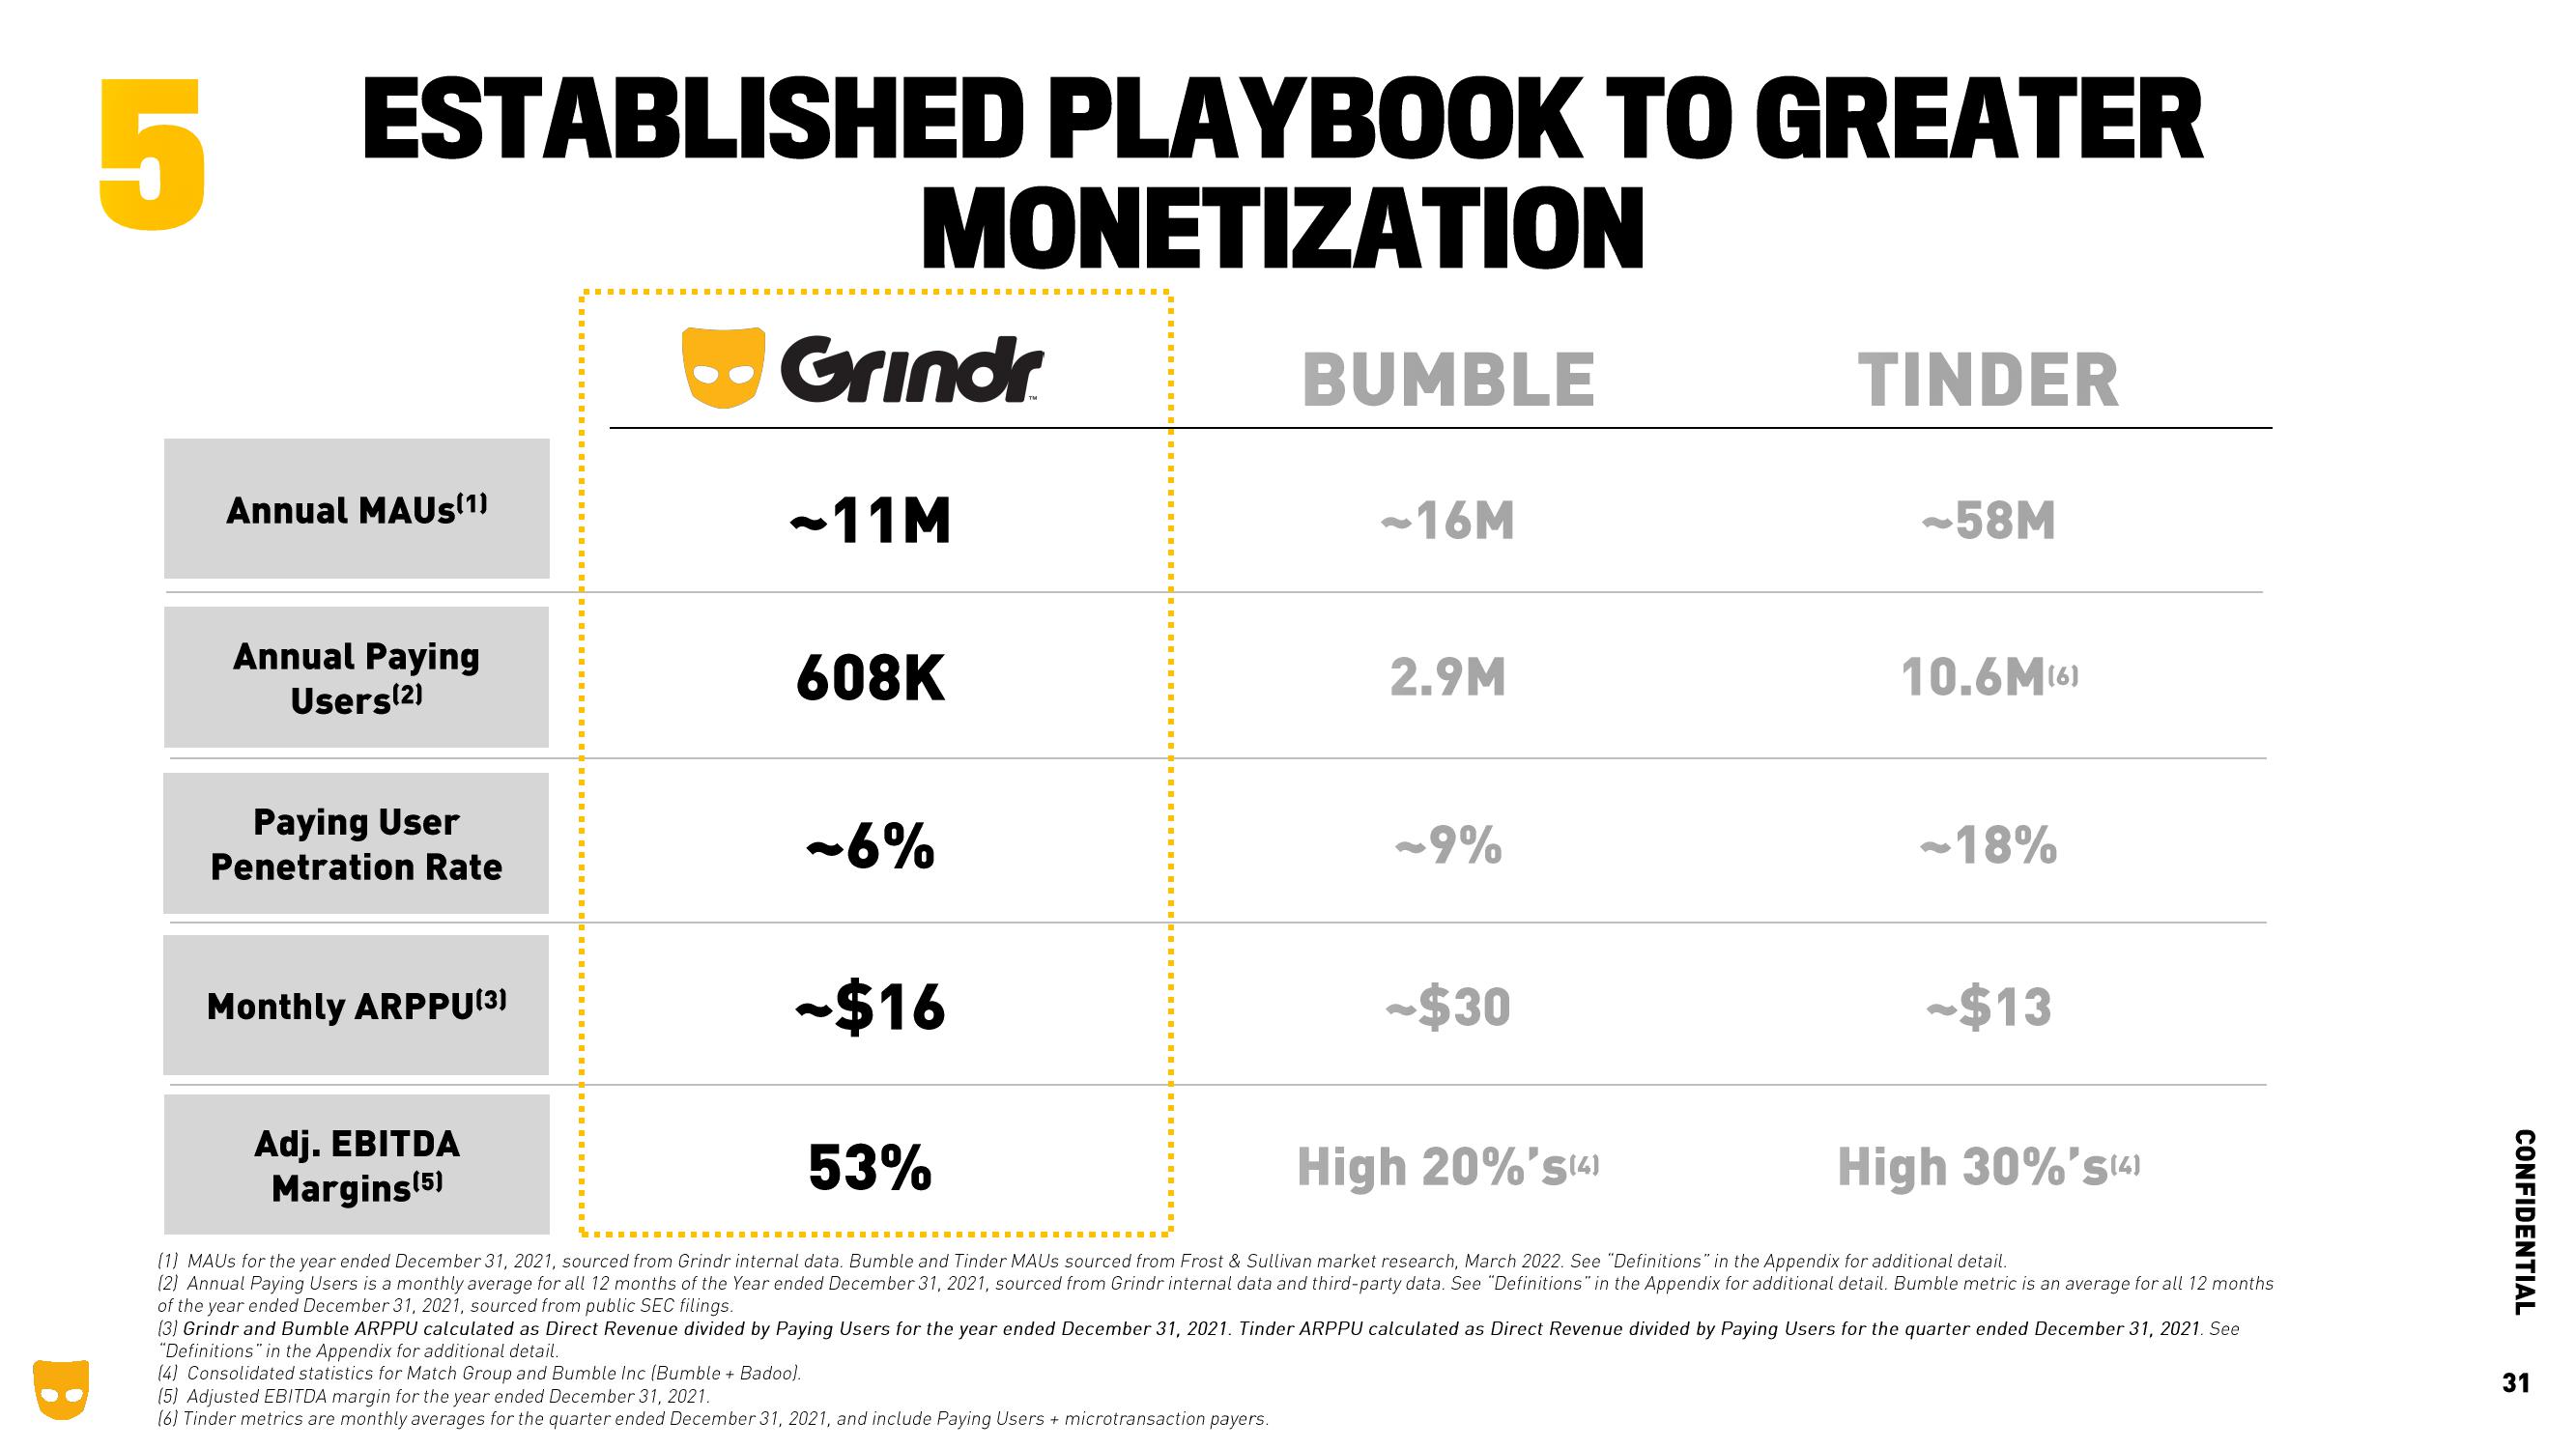
ESTABLISHED PLAYBOOK TO GREATER
MONETIZATION
Annual MAUS(1)
Annual Paying
Users(2)
Paying User
Penetration Rate
Monthly ARPPU(3)
Adj. EBITDA
Margins (5)
I
■
n
W
■
I
·
W
I
■
H
W
1
B
"
■
·
■
I
·
■
W
.
■
Grindr
-11M
608K
~6%
-$16
‒‒‒‒‒‒‒‒‒‒
53%
■
■
H
W
■
■
"
■
H
A
■
H
■
H
D
■
■
"
H
■
■
H
H
■
H
.
H
A
D
D
"
■
H
H
D
M
BUMBLE
-16M
(5) Adjusted EBITDA margin for the year ended December 31, 2021.
(6) Tinder metrics are monthly averages for the quarter ended December 31, 2021, and include Paying Users + microtransaction payers.
2.9M
~9%
-$30
High 20%'s(4)
TINDER
-58M
10.6M(6)
-18%
-$13
High 30%'s(4)
(1) MAUS for the year ended December 31, 2021, sourced from Grindr internal data. Bumble and Tinder MAUS sourced from Frost & Sullivan market research, March 2022. See "Definitions" in the Appendix for additional detail.
(2) Annual Paying Users is a monthly average for all 12 months of the Year ended December 31, 2021, sourced from Grindr internal data and third-party data. See "Definitions" in the Appendix for additional detail. Bumble metric is an average for all 12 months
of the year ended December 31, 2021, sourced from public SEC filings.
(3) Grindr and Bumble ARPPU calculated as Direct Revenue divided by Paying Users for the year ended December 31, 2021. Tinder ARPPU calculated as Direct Revenue divided by Paying Users for the quarter ended December 31, 2021. See
"Definitions" in the Appendix for additional detail.
(4) Consolidated statistics for Match Group and Bumble Inc (Bumble + Badoo).
CONFIDENTIAL
31View entire presentation