Nauticus SPAC Presentation Deck
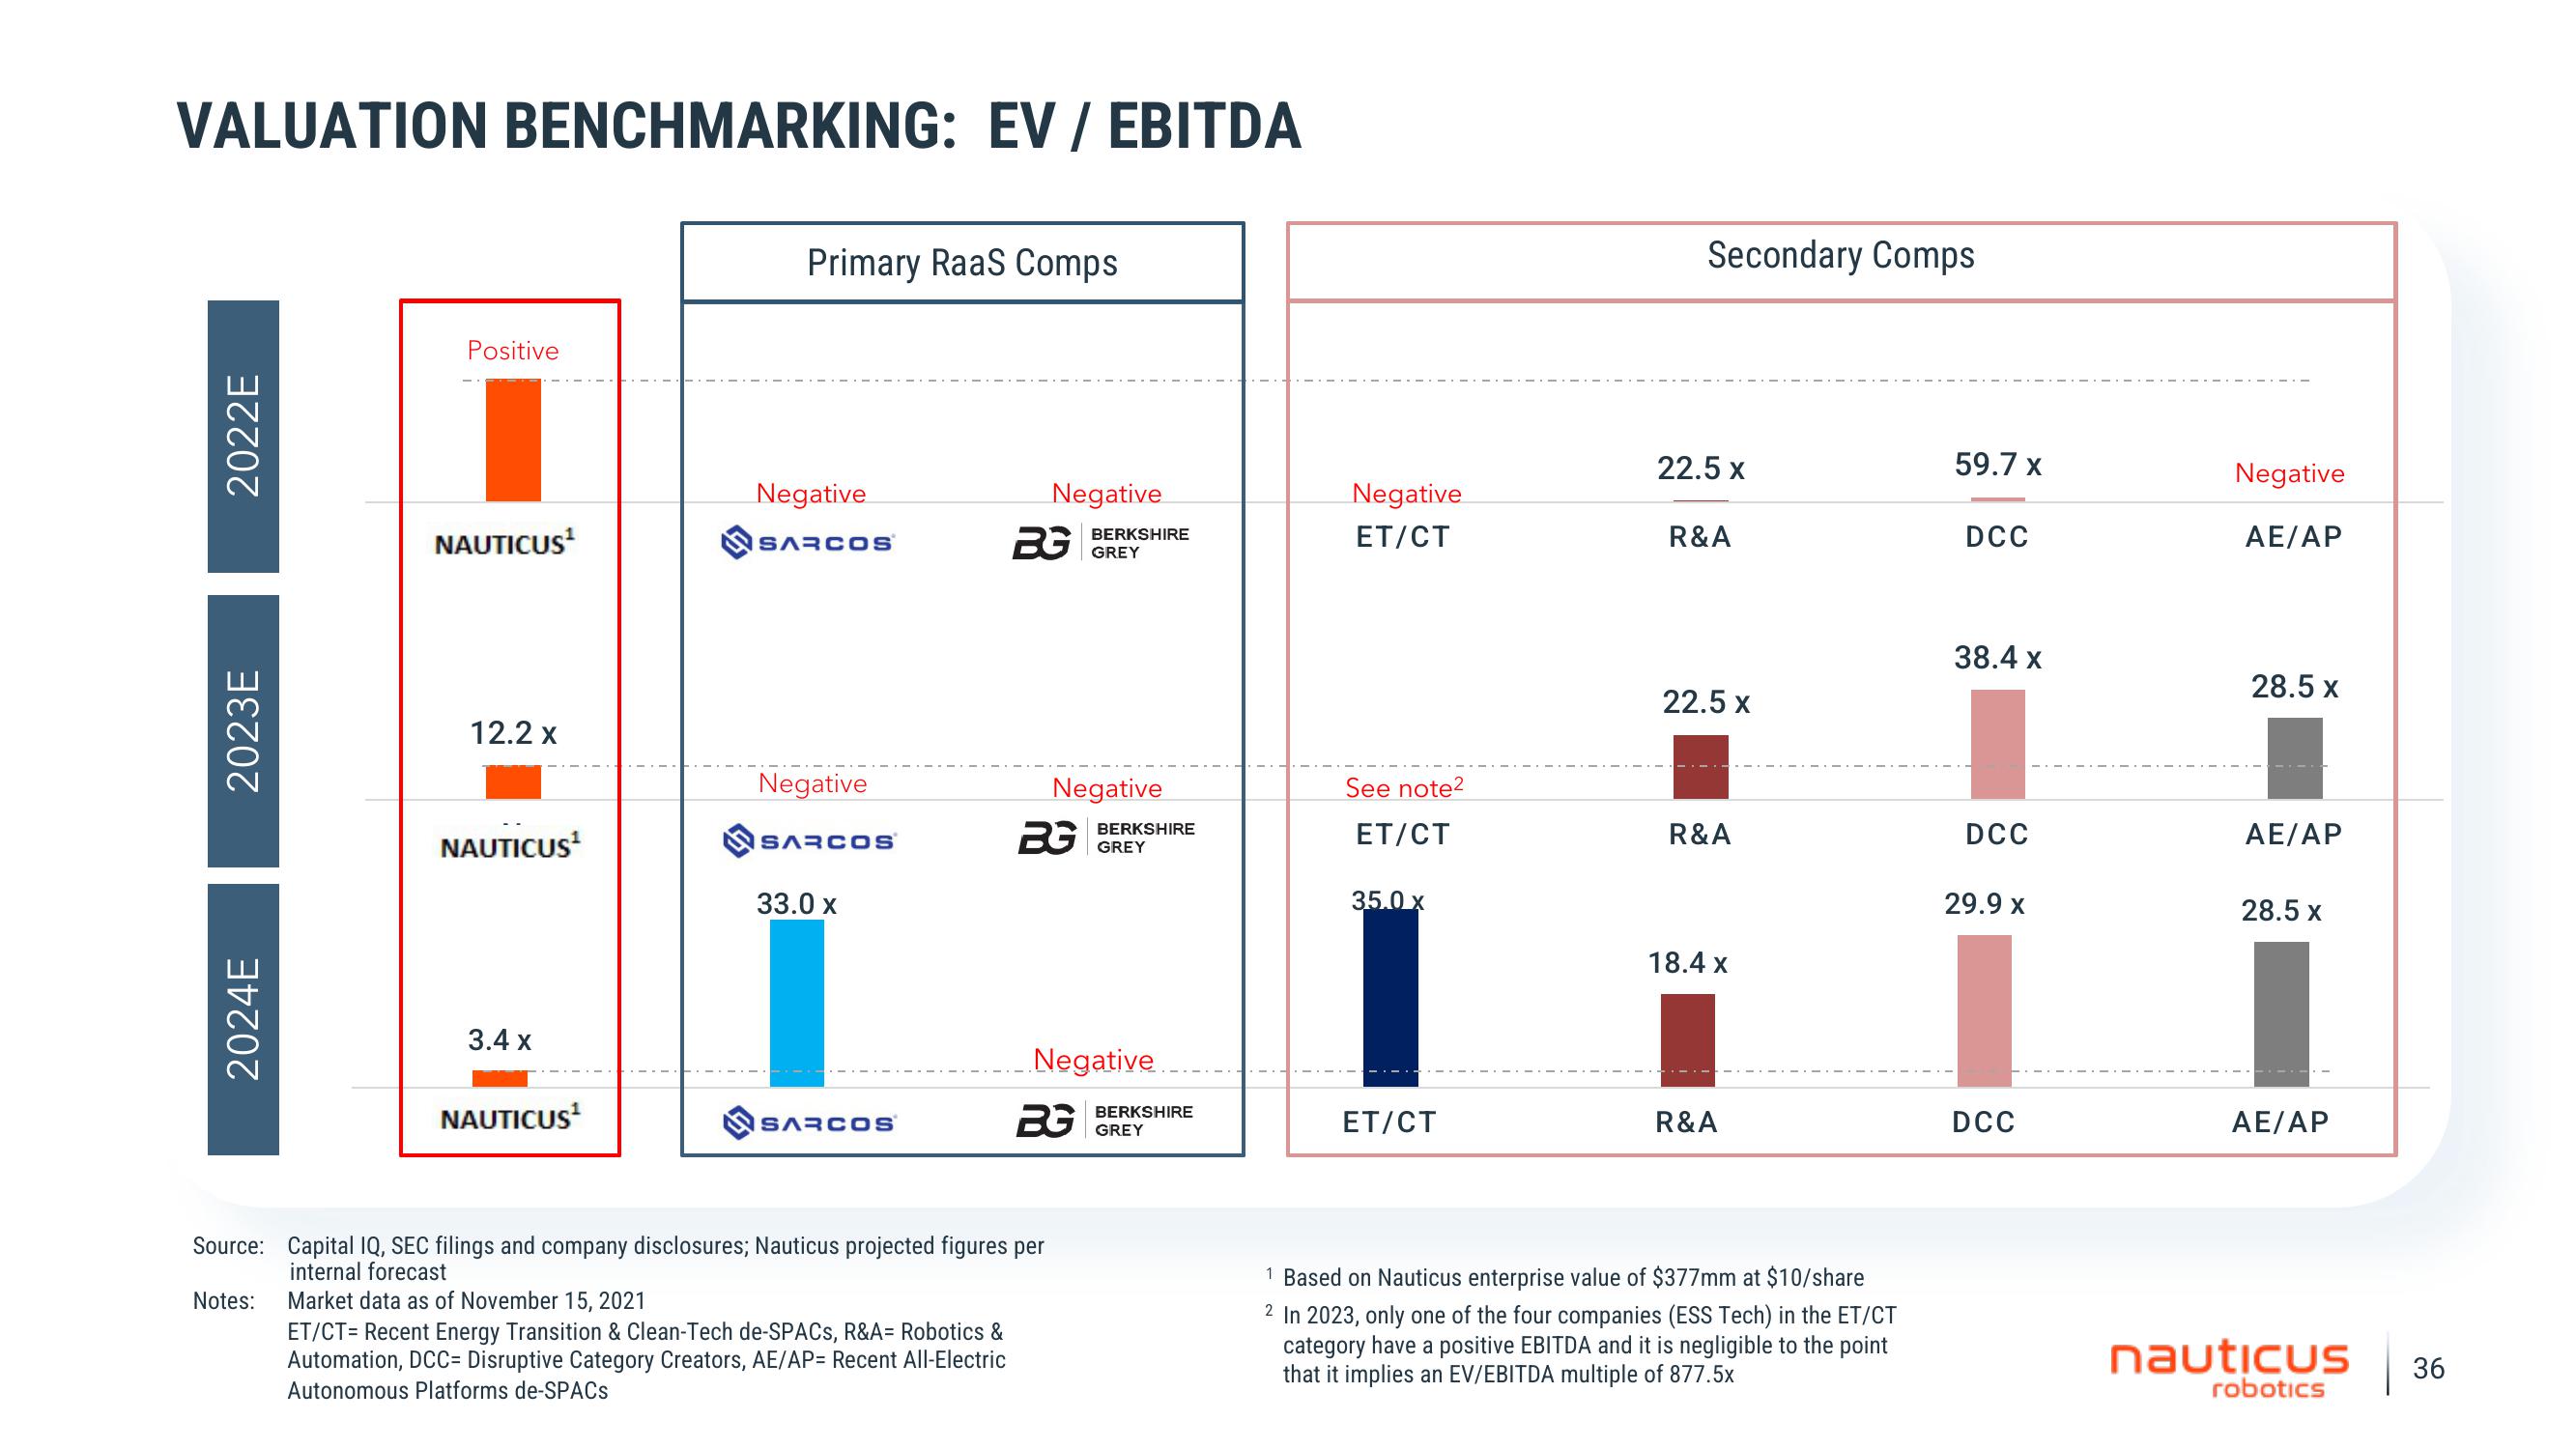
VALUATION BENCHMARKING: EV / EBITDA
2022E
2023E
2024E
Positive
NAUTICUS¹
12.2 x
NAUTICUS¹
3.4 x
NAUTICUS¹
Primary RaaS Comps
Negative
sAacos
Negative
sAacos
33.0 x
sAacos
Negative
BG
BG
Source: Capital IQ, SEC filings and company disclosures; Nauticus projected figures per
internal forecast
Notes:
Market data as of November 15, 2021
ET/CT= Recent Energy Transition & Clean-Tech de-SPACS, R&A= Robotics &
Automation, DCC= Disruptive Category Creators, AE/AP= Recent All-Electric
Autonomous Platforms de-SPACS
BERKSHIRE
GREY
Negative
BERKSHIRE
GREY
Negative
BG
BERKSHIRE
GREY
Negative
ET/CT
See note2
ET/CT
35.0 x
ET/CT
Secondary Comps
22.5 x
R&A
22.5 x
R&A
18.4 x
R&A
1 Based on Nauticus enterprise value of $377mm at $10/share
2 In 2023, only one of the four companies (ESS Tech) in the ET/CT
category have a positive EBITDA and it is negligible to the point
that it implies an EV/EBITDA multiple of 877.5x
59.7 x
DCC
38.4 x
DCC
29.9 x
DCC
Negative
AE/AP
28.5 x
AE/AP
28.5 x
AE/AP
nauticus
robotics
36View entire presentation