Embracer Group Results Presentation Deck
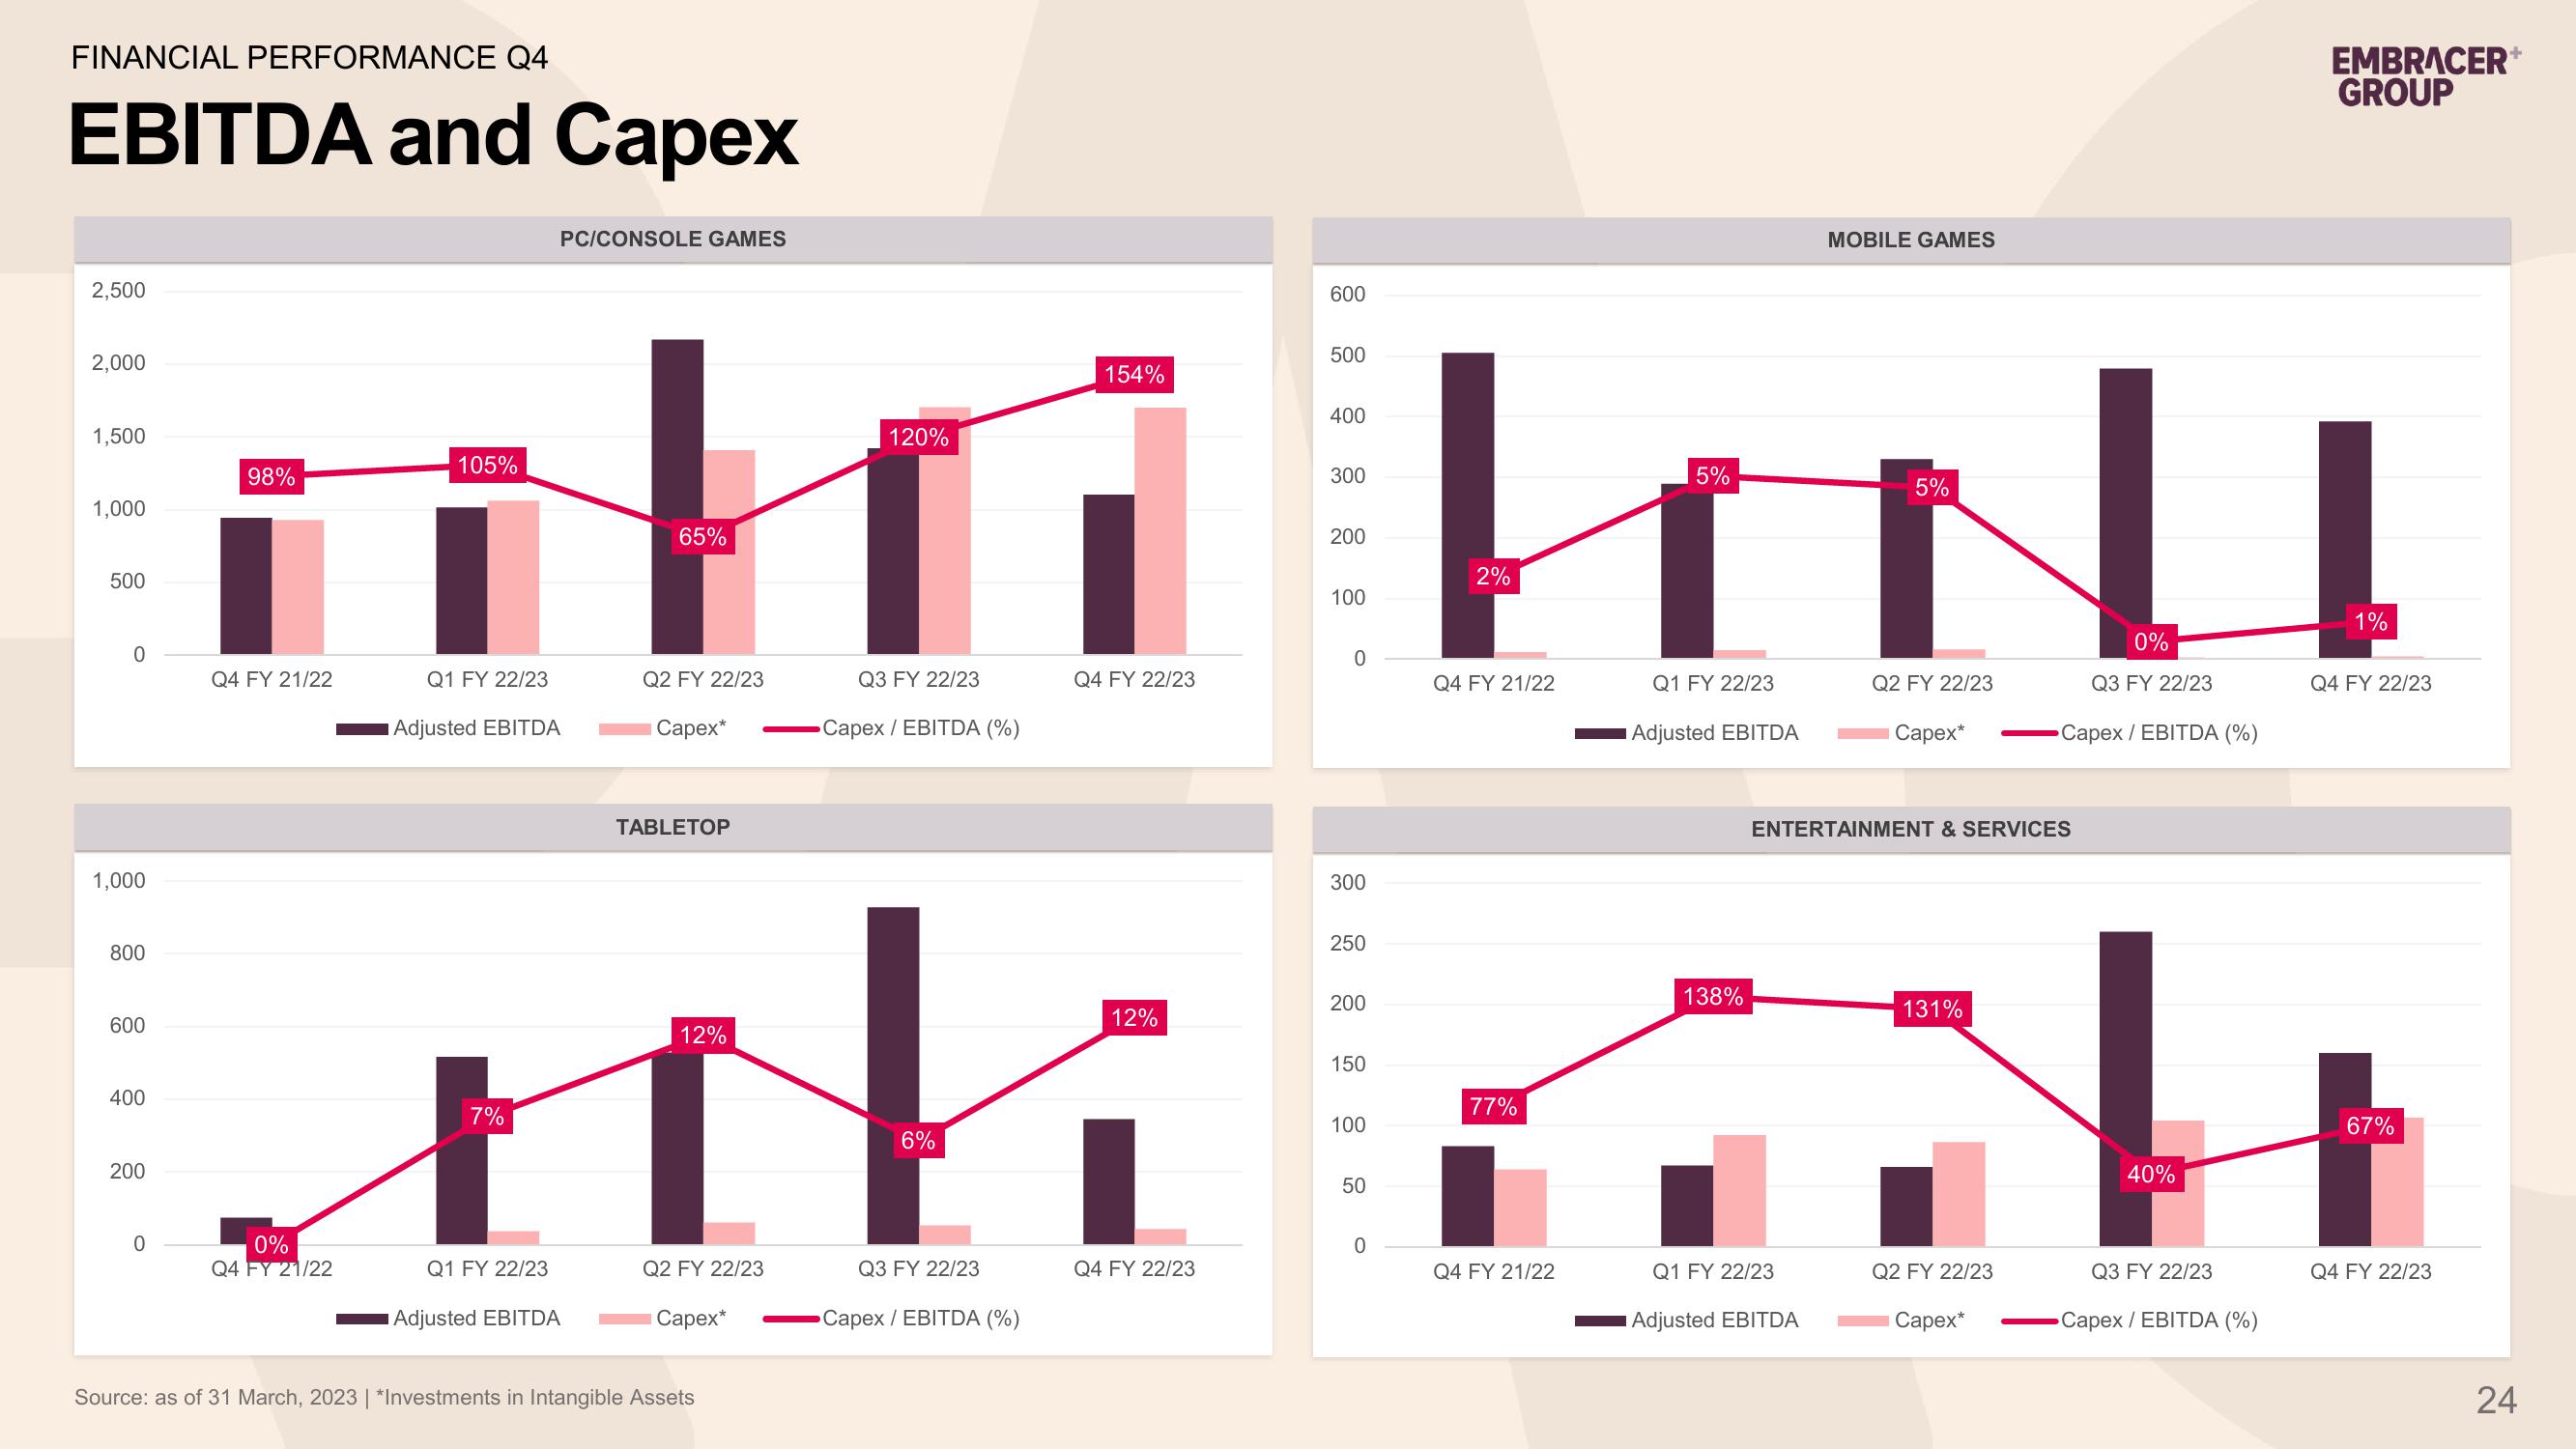
FINANCIAL PERFORMANCE Q4
EBITDA and Capex
2,500
2,000
1,500
1,000
500
0
1,000
800
600
400
200
0
98%
Q4 FY 21/22
105%
5%
5%
tihti kooli
65%
Q2 FY 22/23
Q2 FY 22/23
0%
Q4 FY 21/22
PC/CONSOLE GAMES
Q1 FY 22/23
Adjusted EBITDA
7%
Q1 FY 22/23
Capex*
Adjusted EBITDA
TABLETOP
Capex*
120%
Source: as of 31 March, 2023 | *Investments in Intangible Assets
Q3 FY 22/23
Capex / EBITDA (%)
6%
Q3 FY 22/23
154%
12%
uh
Q2 FY 22/23
Capex / EBITDA (%)
Q4 FY 22/23
600
12%
Q4 FY 22/23
500
400
300
200
100
0
300
250
200
150
100
50
0
2%
Q4 FY 21/22
77%
Q4 FY 21/22
Q1 FY 22/23
Adjusted EBITDA
138%
MOBILE GAMES
Q1 FY 22/23
Adjusted EBITDA
Capex*
ENTERTAINMENT & SERVICES
131%
Q2 FY 22/23
Capex*
0%
Q3 FY 22/23
Capex / EBITDA (%)
40%
EMBRACER+
GROUP
Q3 FY 22/23
Capex / EBITDA (%)
1%
Q4 FY 22/23
67%
Q4 FY 22/23
24View entire presentation