Altus Power Investor Presentation Deck
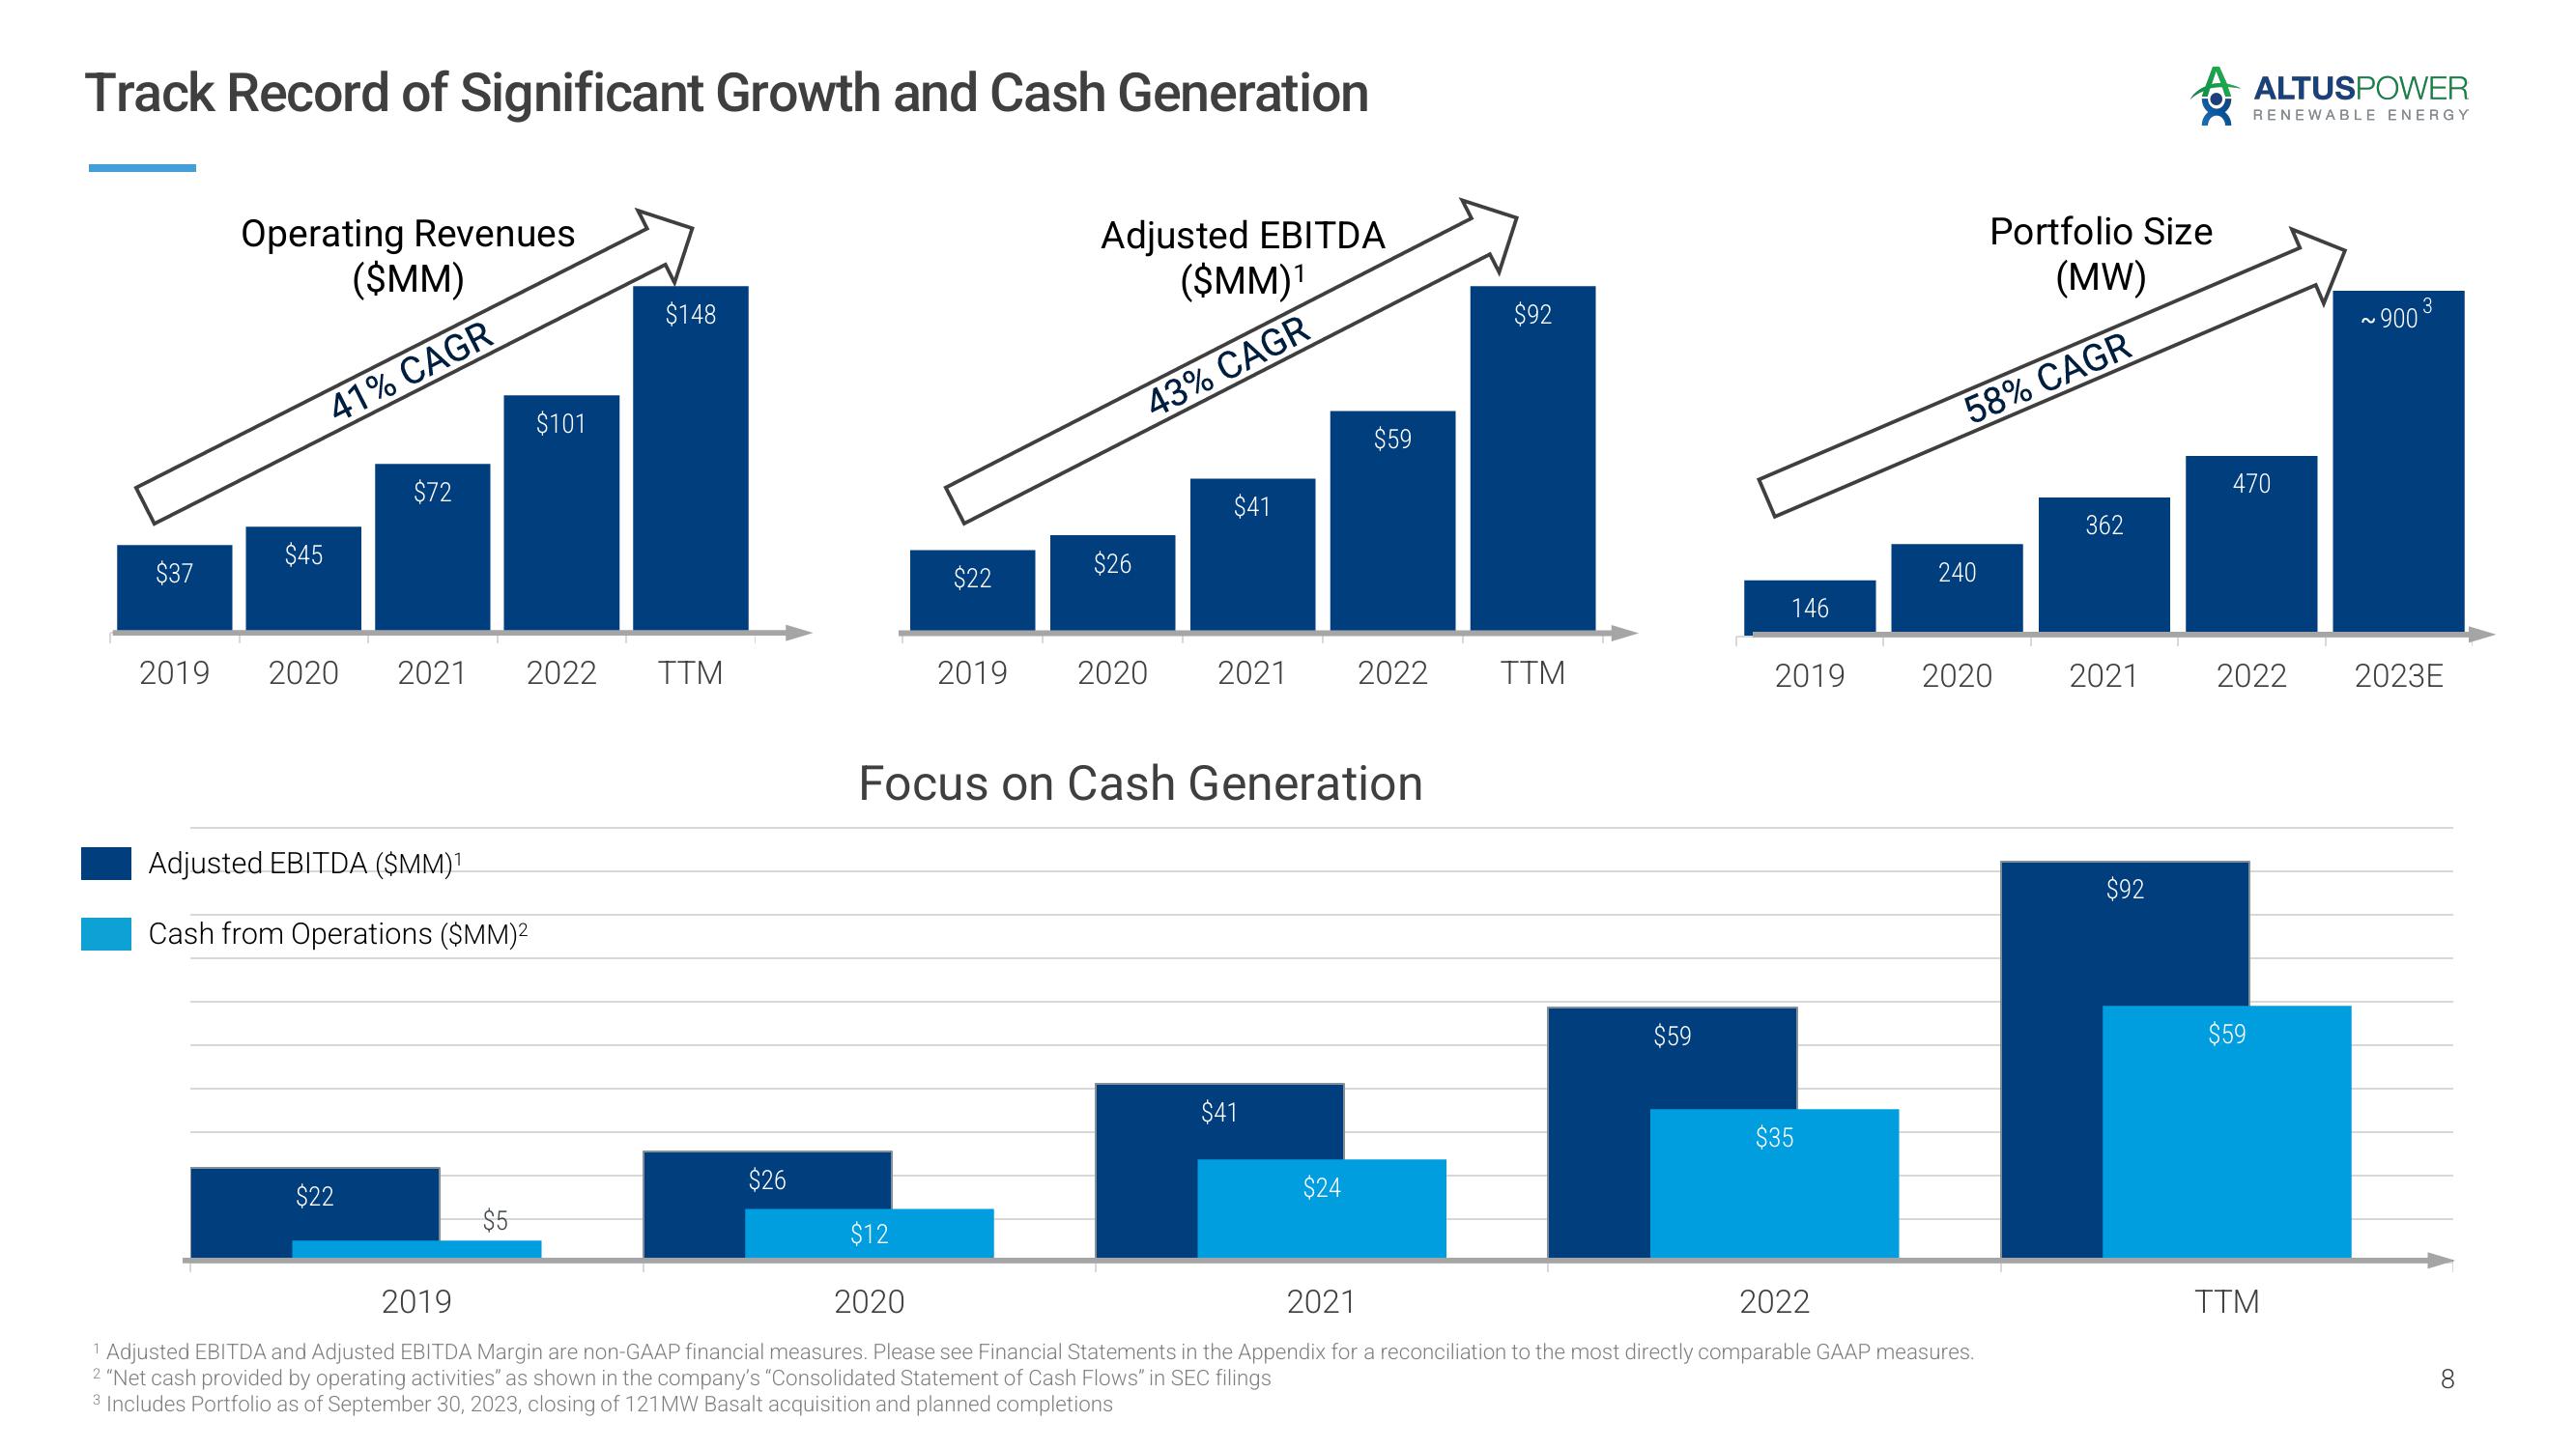
Track Record of Significant Growth and Cash Generation
$37
Operating Revenues
($MM)
41% CAGR
$45
$72
Adjusted EBITDA ($MM)¹
Cash from Operations ($MM)²
$22
2019 2020 2021 2022 TTM
$101
$5
$148
$26
$22
$12
Adjusted EBITDA
($MM)¹
43% CAGR
$26
$41
2019 2020 2021
Focus on Cash Generation
$41
$59
$24
2022
$92
TTM
$59
146
2019
$35
58% CAGR
240
Portfolio Size
(MW)
2020
2019
2020
2021
2022
1 Adjusted EBITDA and Adjusted EBITDA Margin are non-GAAP financial measures. Please see Financial Statements in the Appendix for a reconciliation to the most directly comparable GAAP measures.
2 "Net cash provided by operating activities" as shown in the company's "Consolidated Statement of Cash Flows" in SEC filings
3 Includes Portfolio as of September 30, 2023, closing of 121 MW Basalt acquisition and planned completions
362
2021
$92
ALTUSPOWER
RENEWABLE ENERGY
470
$59
2022
TTM
3
-900³
2023E
8View entire presentation