Telia Company Results Presentation Deck
LED markets
Lithuania
Reported currency, in SEK millions, like for like growth
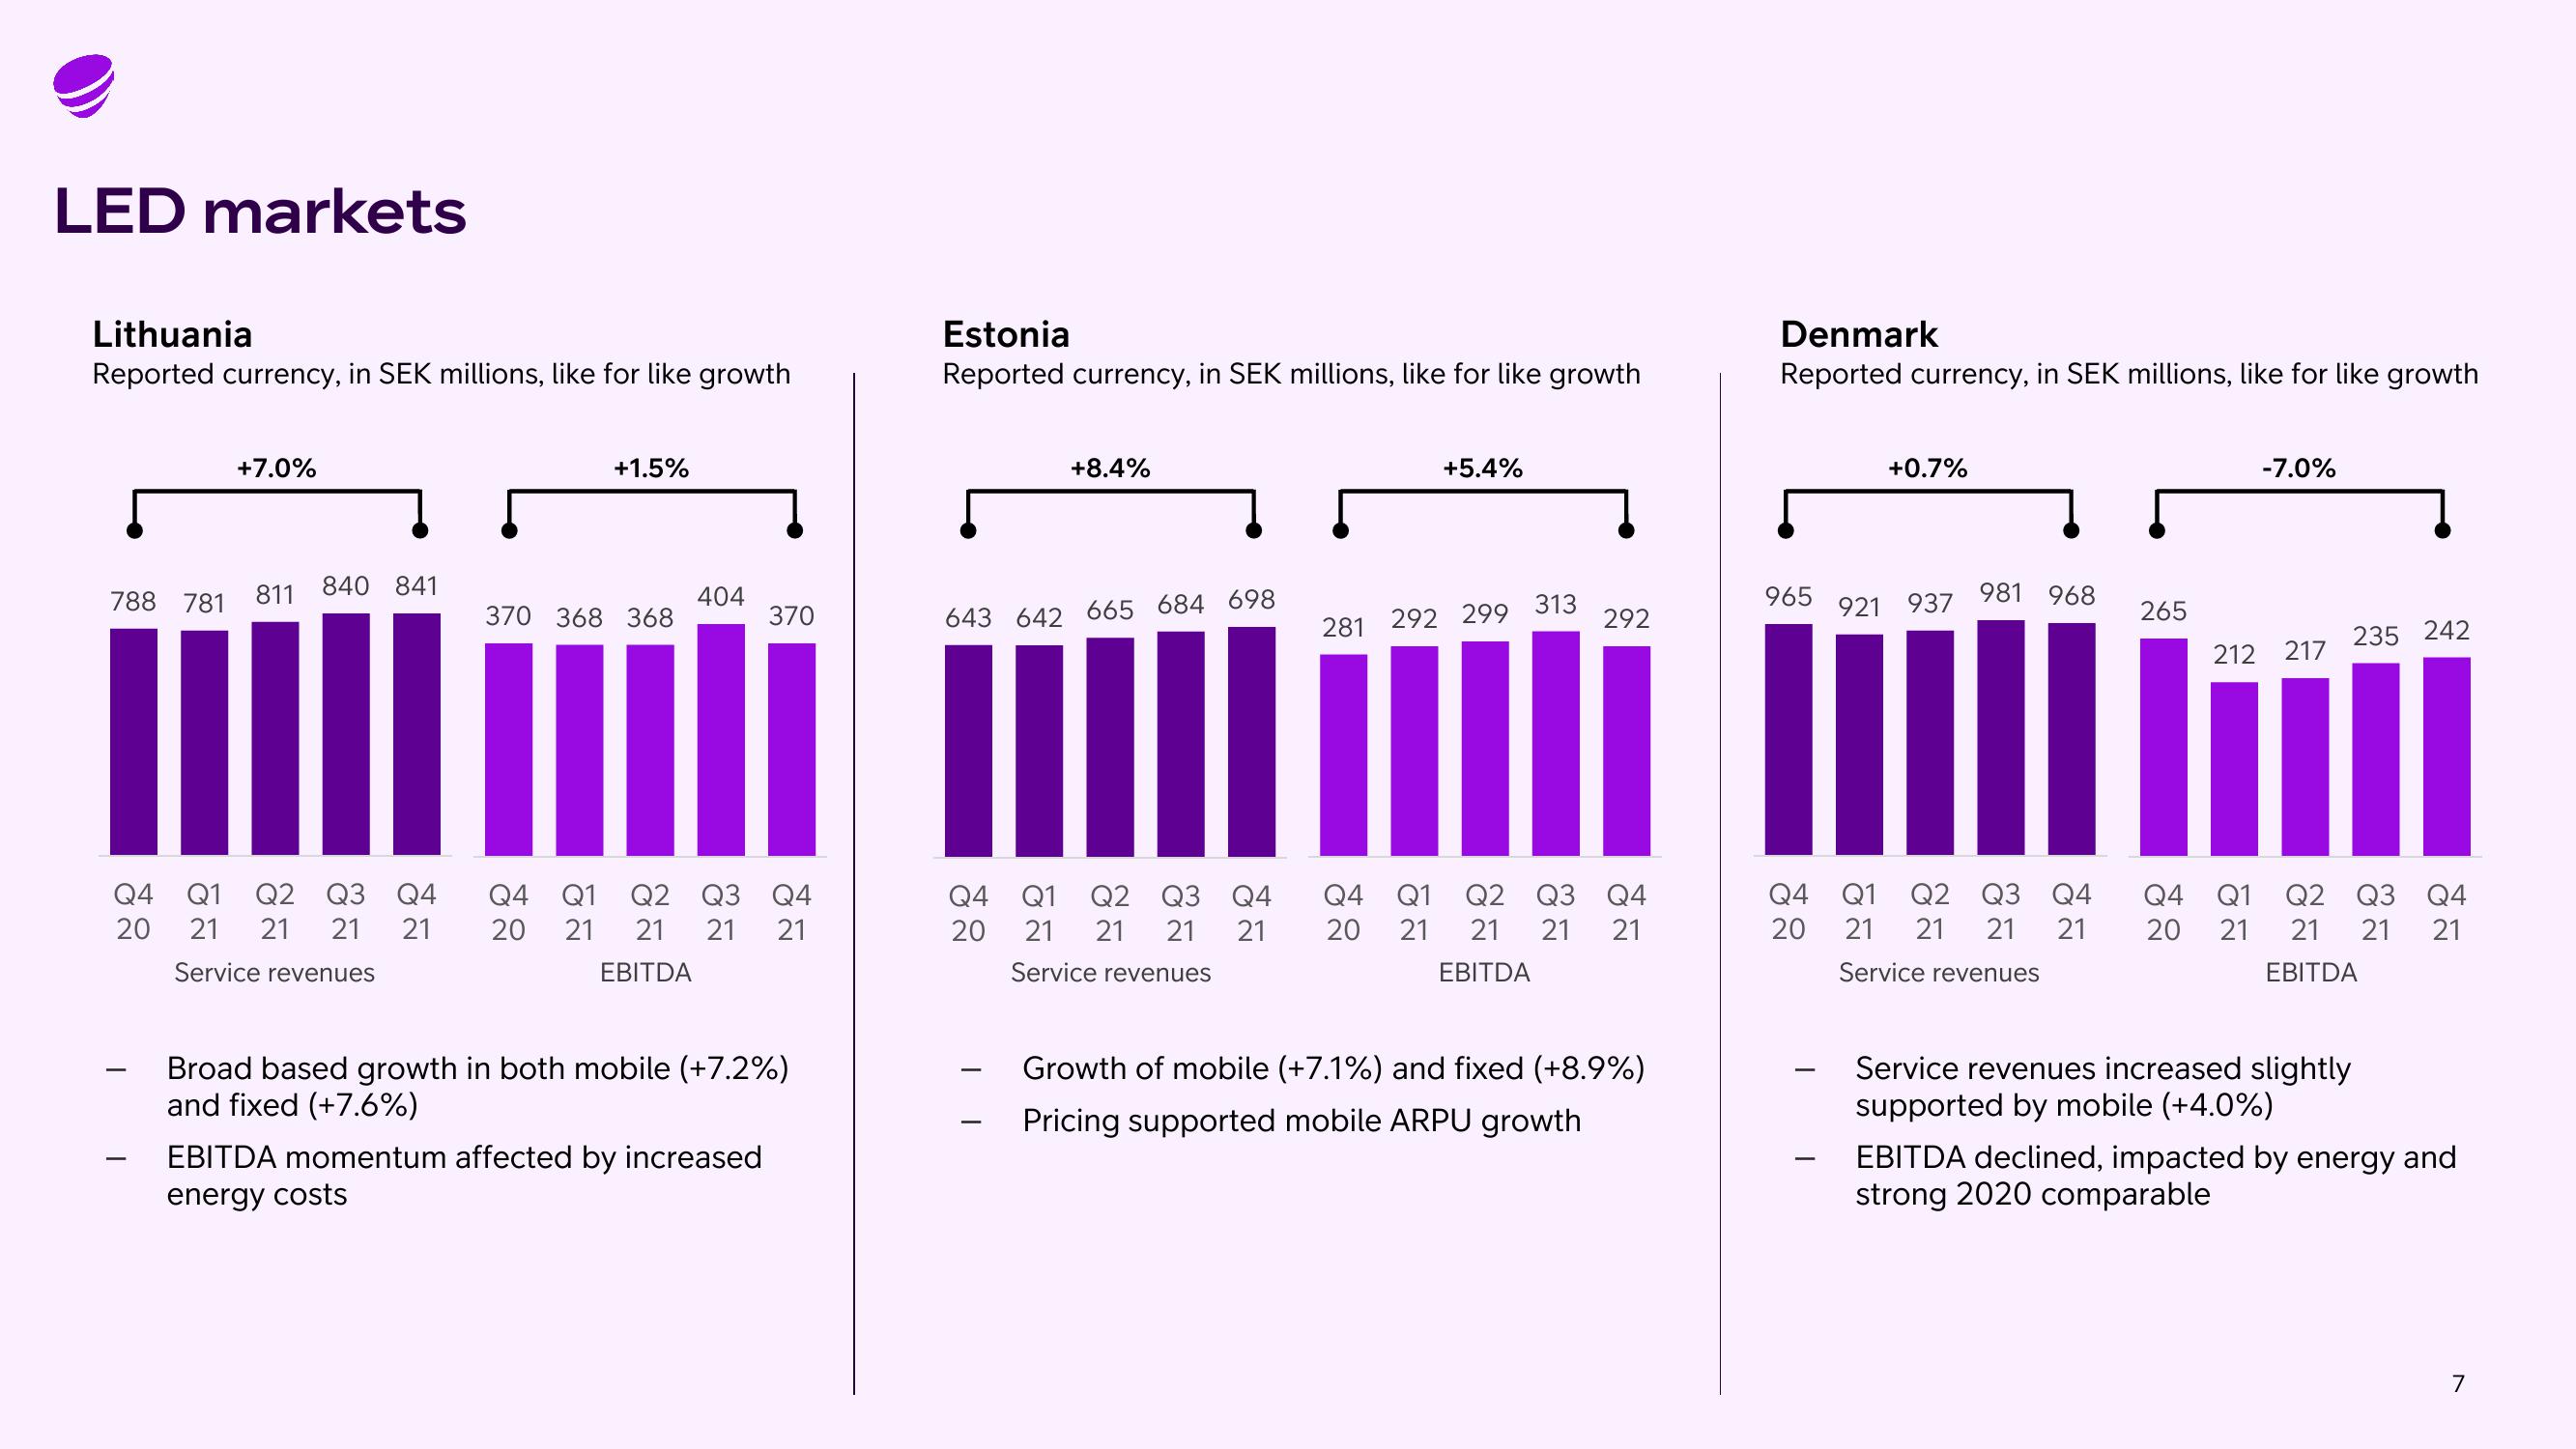
788 781
+7.0%
811
840 841
Q4 Q1 Q2 Q3 Q4
20
21 21 21 21
Service revenues
+1.5%
370 368 368
404
370
Q4 Q1 Q2 Q3 Q4
20 21 21 21 21
EBITDA
Broad based growth in both mobile (+7.2%)
and fixed (+7.6%)
EBITDA momentum affected by increased
energy costs
Estonia
Reported currency, in SEK millions, like for like growth
+8.4%
643 642 665 684 698
Q4 Q1 Q2 Q3 Q4
20 21 21 21 21
Service revenues
+5.4%
281 292 299 313
292
Q4 Q1 Q2 Q3 Q4
20 21 21 21 21
EBITDA
Growth of mobile (+7.1%) and fixed (+8.9%)
Pricing supported mobile ARPU growth
Denmark
Reported currency, in SEK millions, like for like growth
965
+0.7%
921 937
981 968
Q4 Q1 Q2 Q3 Q4
20
21 21 21 21
Service revenues
265
-7.0%
212 217
235 242
Q4 Q1 Q2 Q3 Q4
20 21 21 21 21
EBITDA
Service revenues increased slightly
supported by mobile (+4.0%)
EBITDA declined, impacted by energy and
strong 2020 comparable
7View entire presentation