Benson Hill Results Presentation Deck
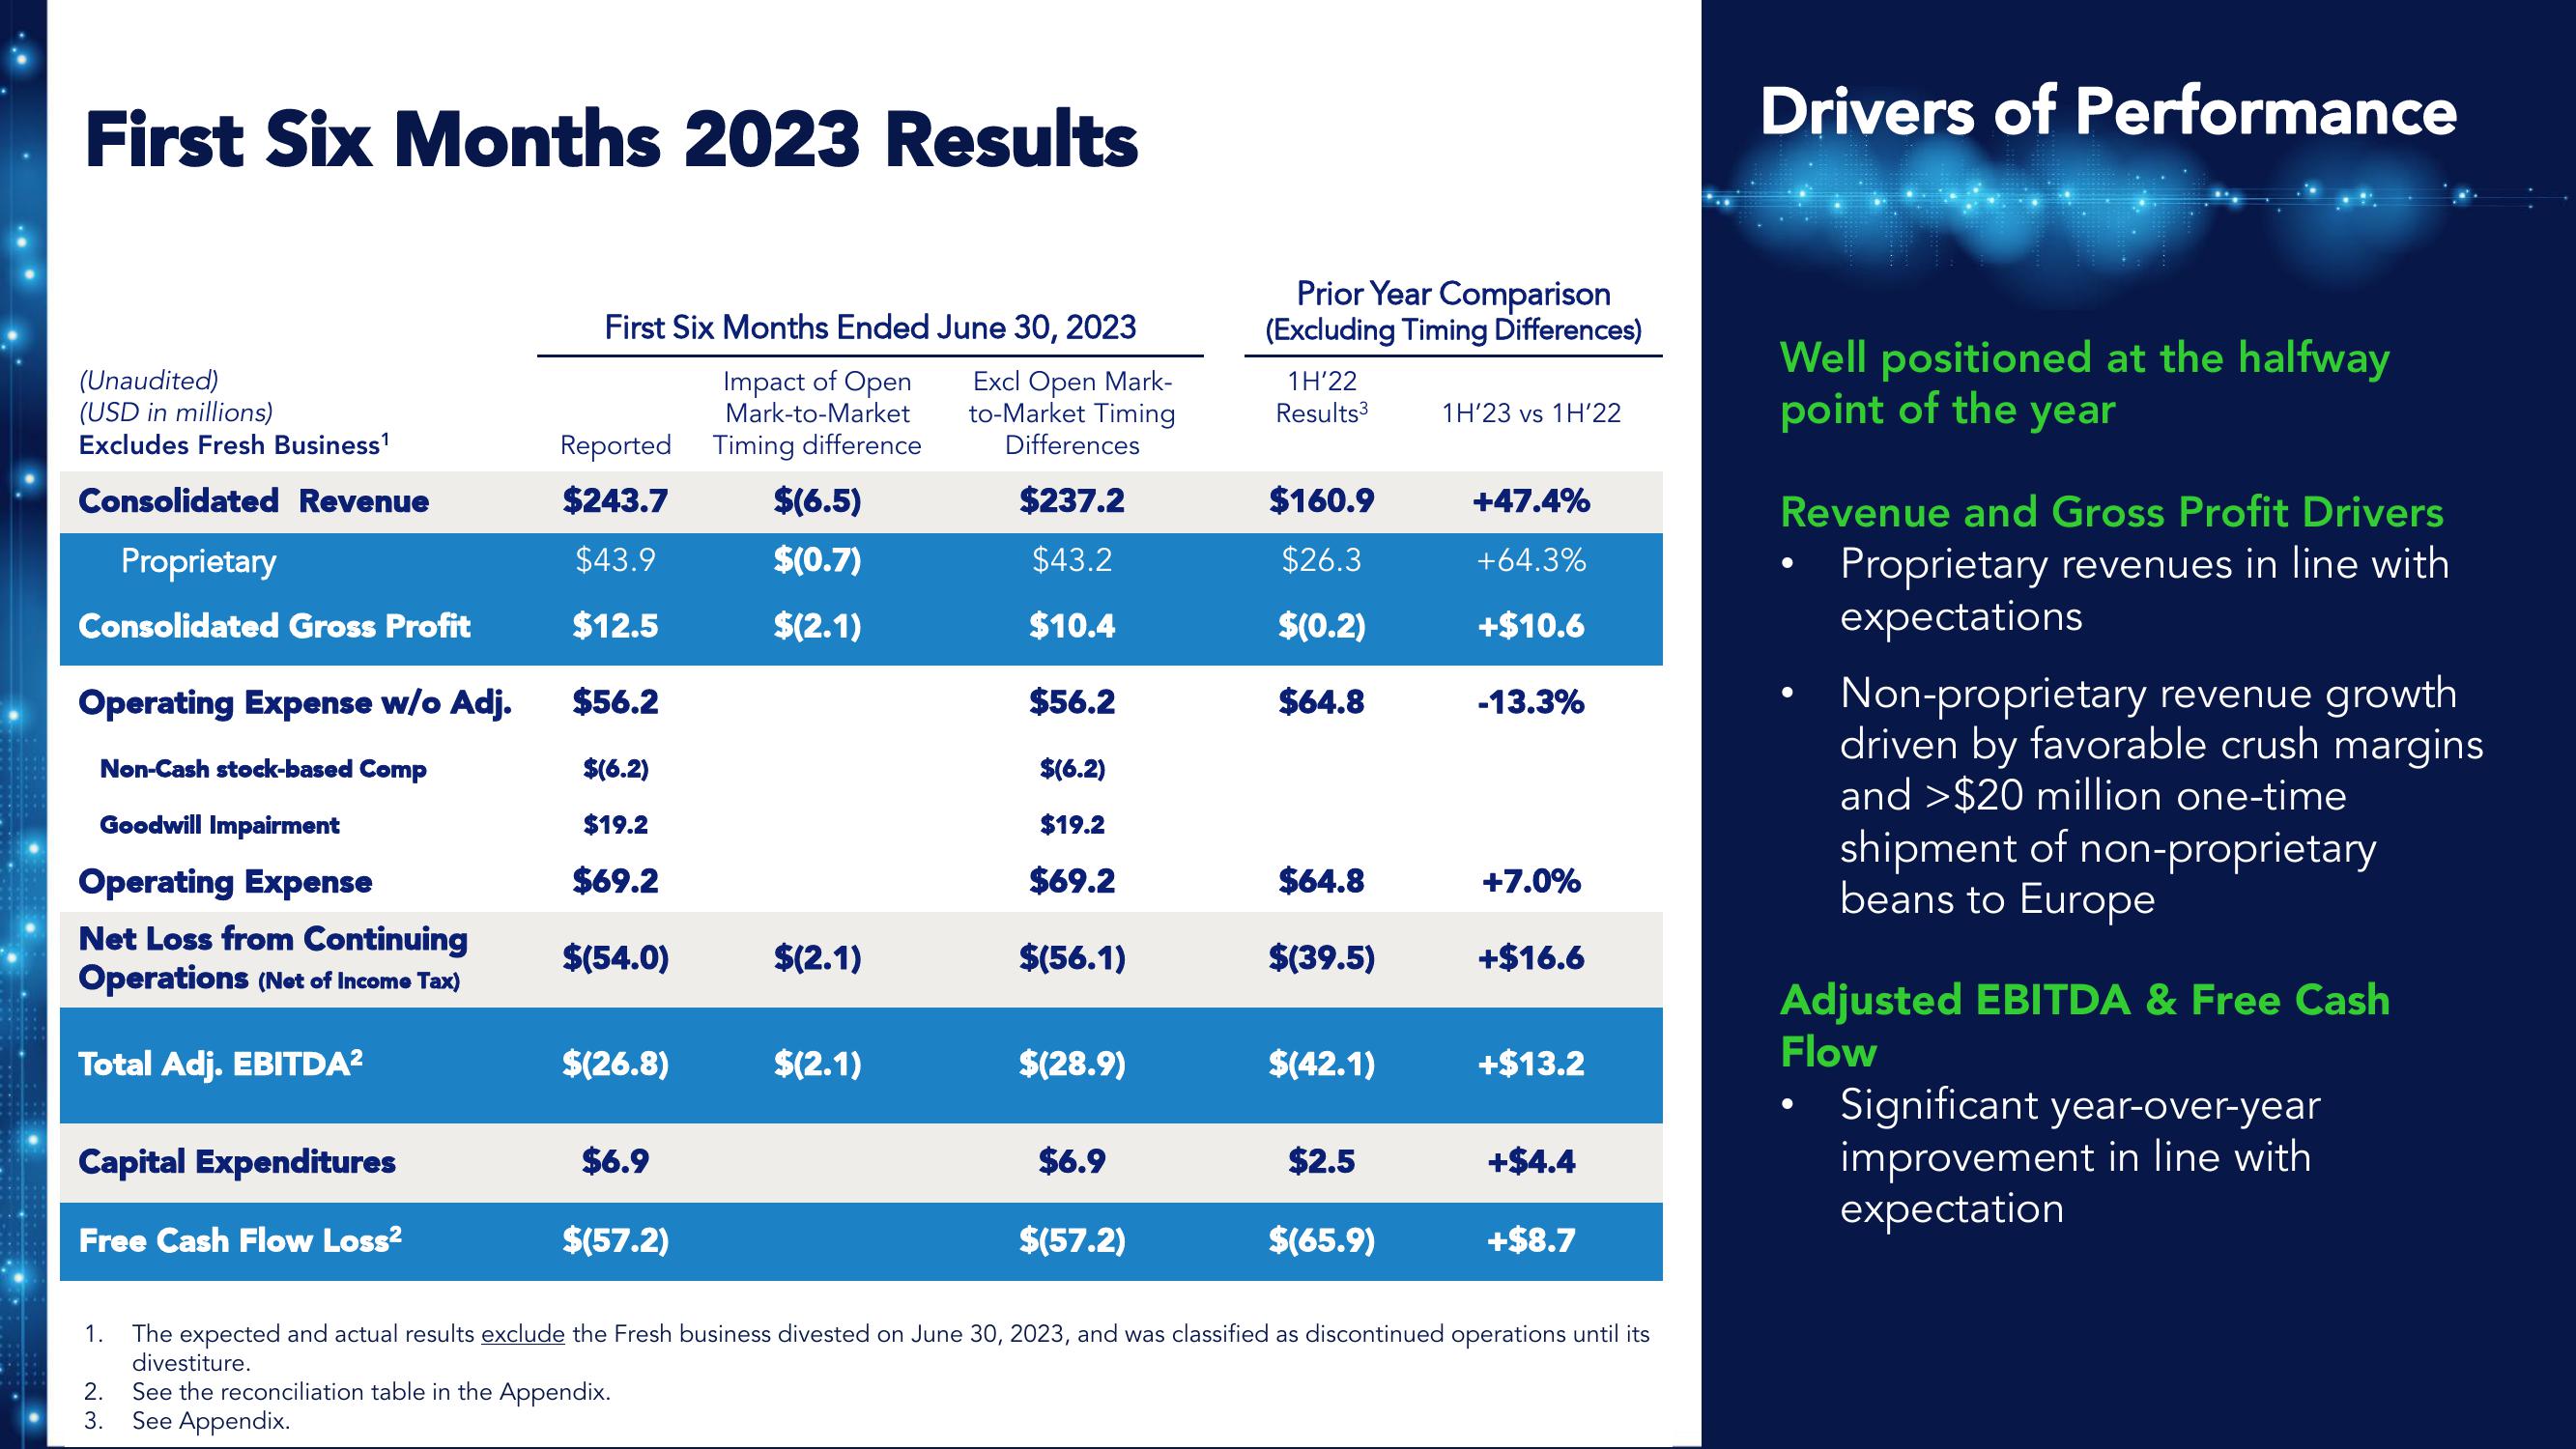
First Six Months 2023 Results
(Unaudited)
(USD in millions)
Excludes Fresh Business¹
Consolidated Revenue
Proprietary
Consolidated Gross Profit
Operating Expense w/o Adj.
Non-Cash stock-based Comp
Goodwill Impairment
Operating Expense
Net Loss from Continuing
Operations (Net of Income Tax)
Total Adj. EBITDA²
Capital Expenditures
Free Cash Flow Loss²
First Six Months Ended June 30, 2023
Impact of Open
Mark-to-Market
Reported Timing difference
$243.7
$43.9
$12.5
1.
$56.2
$(6.2)
$19.2
$69.2
$(54.0)
$(26.8)
$6.9
$(57.2)
$(6.5)
$(0.7)
$(2.1)
$(2.1)
$(2.1)
Excl Open Mark-
to-Market Timing
Differences
$237.2
$43.2
$10.4
$56.2
$(6.2)
$19.2
$69.2
$(56.1)
$(28.9)
$6.9
$(57.2)
Prior Year Comparison
(Excluding Timing Differences)
1H'22
Results 3
$160.9
$26.3
$(0.2)
$64.8
$64.8
$(39.5)
$(42.1)
$2.5
$(65.9)
1H'23 vs 1H'22
+47.4%
+64.3%
+$10.6
-13.3%
+7.0%
+$16.6
+$13.2
+$8.7
The expected and actual results exclude the Fresh business divested on June 30, 2023, and was classified as discontinued operations until its
divestiture.
2. See the reconciliation table in the Appendix.
3.
See Appendix.
Drivers of Performance
Well positioned at the halfway
point of the year
Revenue and Gross Profit Drivers
Proprietary revenues in line with
expectations
●
Non-proprietary revenue growth
driven by favorable crush margins
and >$20 million one-time
shipment of non-proprietary
beans to Europe
Adjusted EBITDA & Free Cash
Flow
Significant year-over-year
improvement in line with
expectationView entire presentation