Paysafe Results Presentation Deck
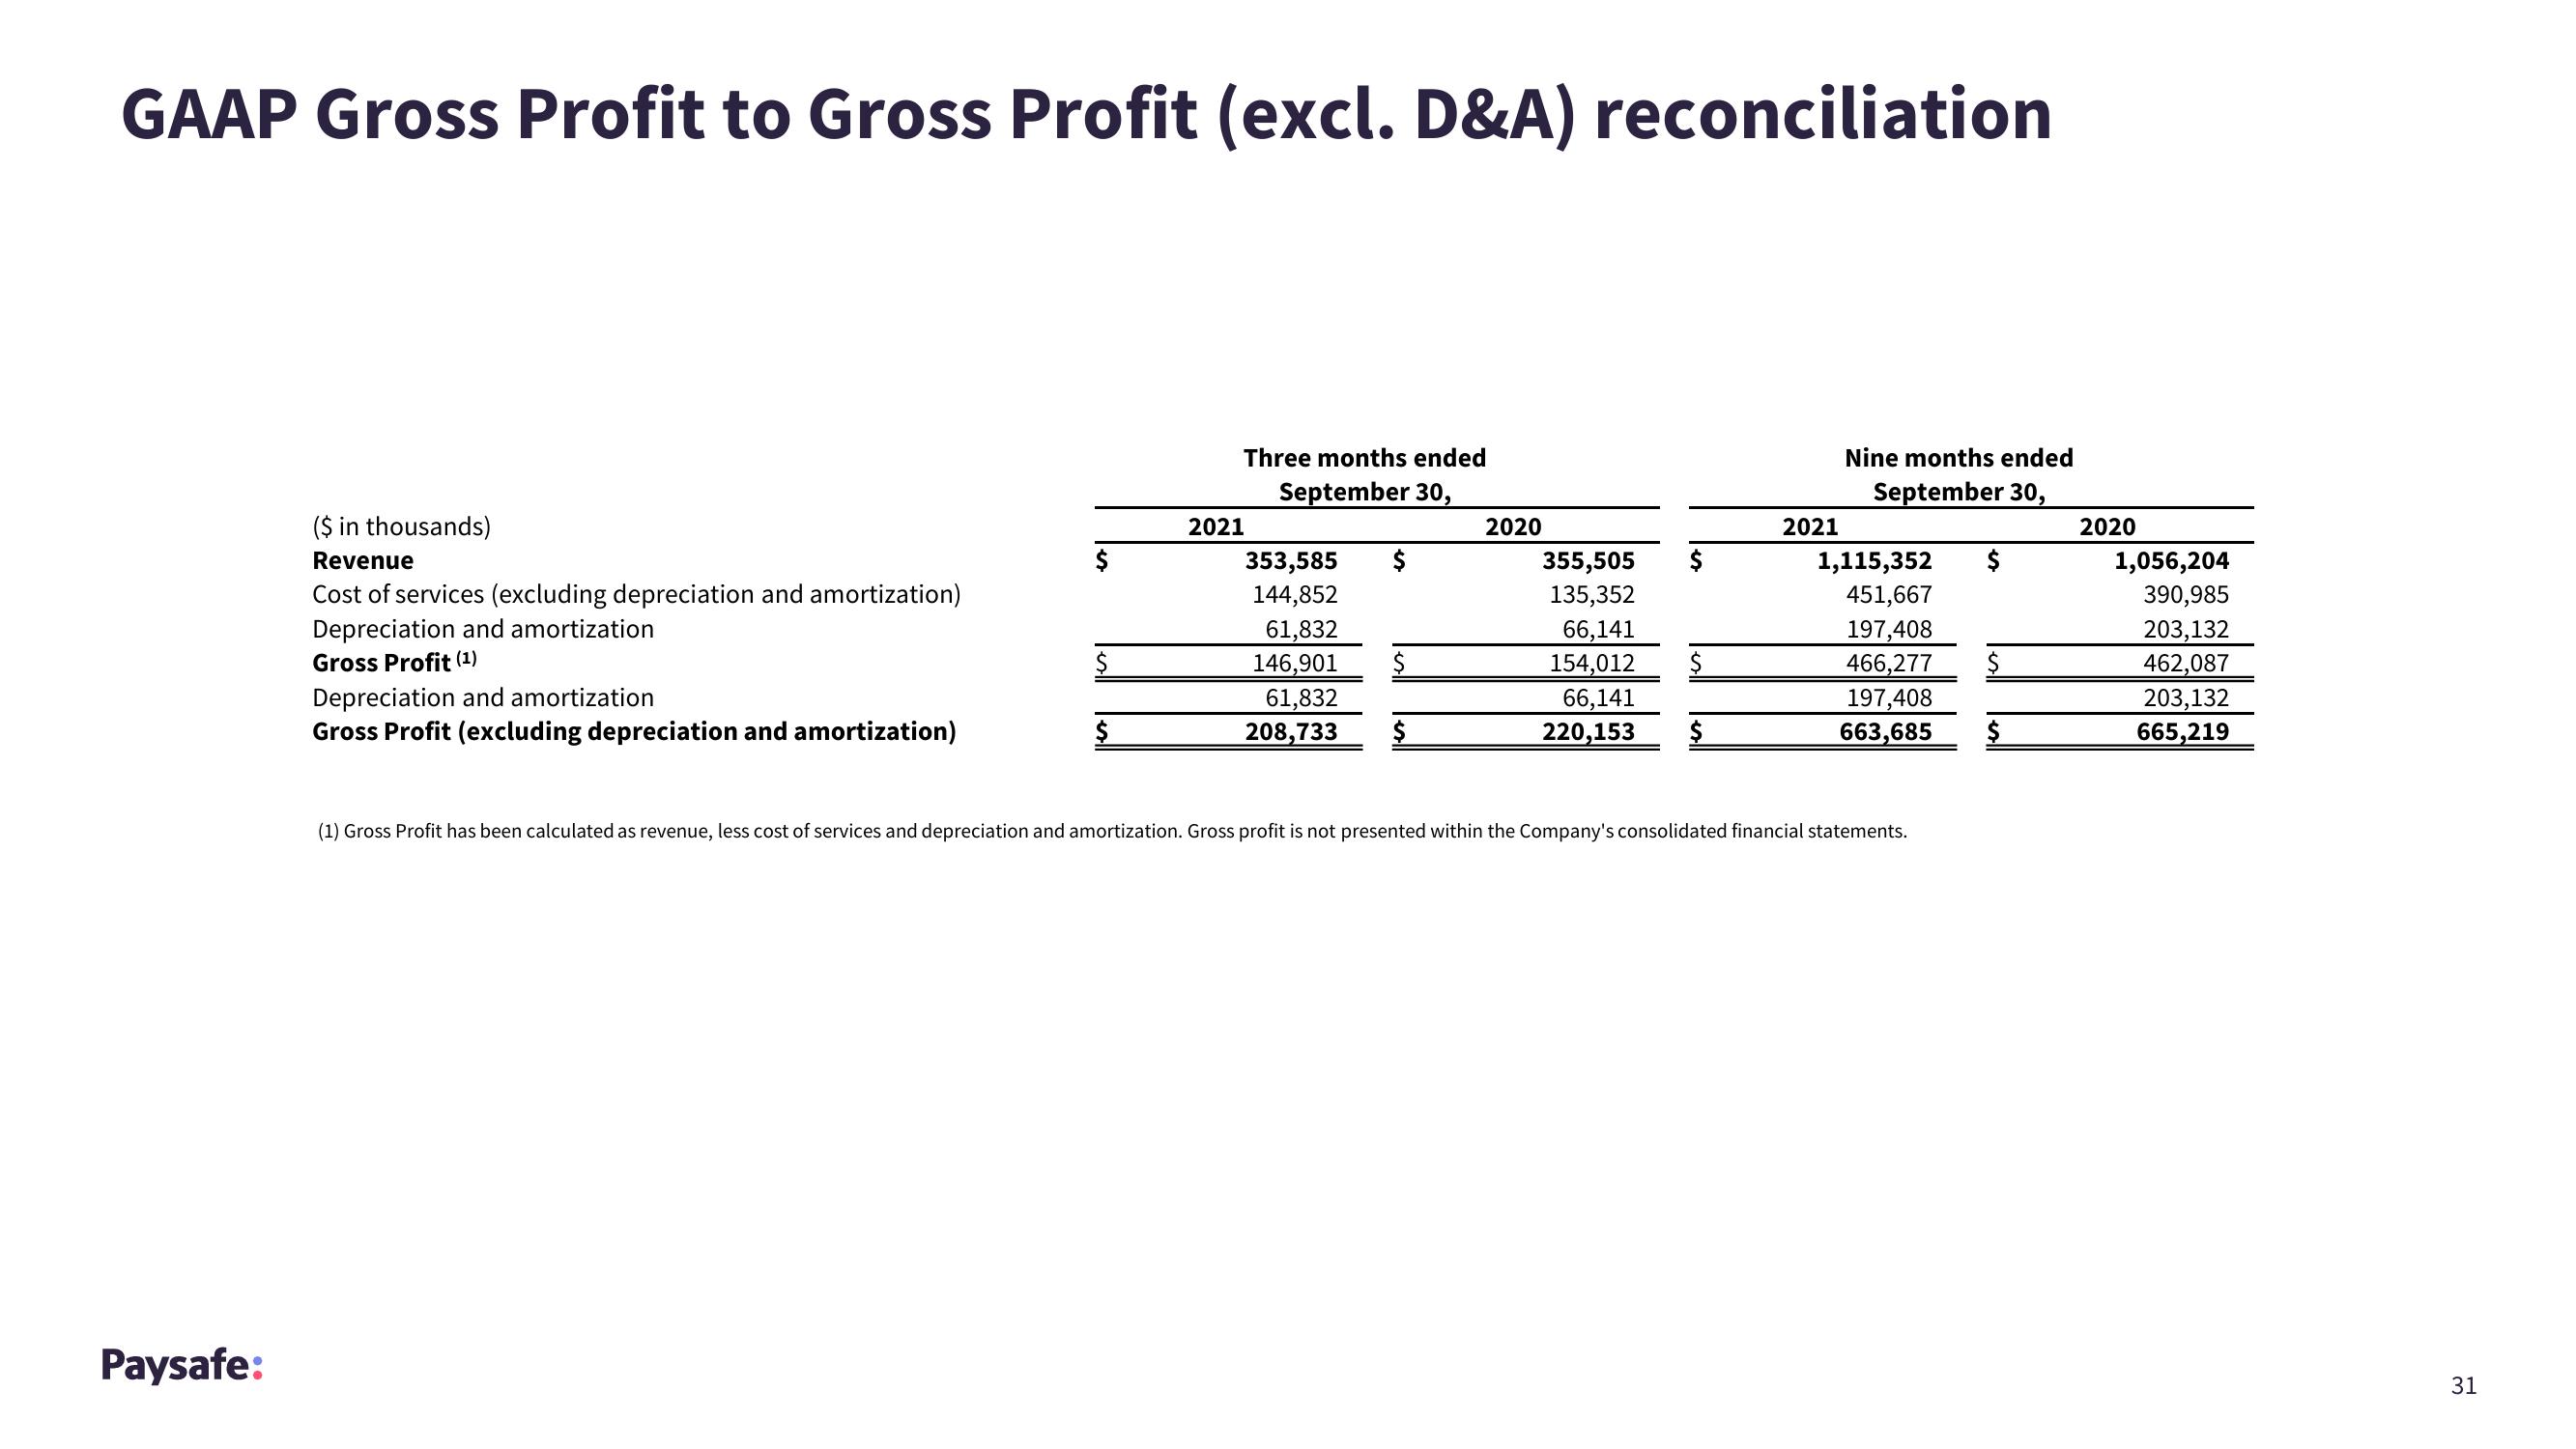
GAAP Gross Profit to Gross Profit (excl. D&A) reconciliation
Paysafe:
($ in thousands)
Revenue
Cost of services (excluding depreciation and amortization)
Depreciation and amortization
Gross Profit (¹)
Depreciation and amortization
Gross Profit (excluding depreciation and amortization)
$
Three months ended
September 30,
2021
353,585
144,852
61,832
146,901
61,832
208,733
$
2020
355,505
135,352
66,141
154,012
66,141
220,153 $
$
2021
Nine months ended
September 30,
1,115,352
451,667
197,408
466,277 $
197,408
663,685
(1) Gross Profit has been calculated as revenue, less cost of services and depreciation and amortization. Gross profit is not presented within the Company's consolidated financial statements.
2020
1,056,204
390,985
203,132
462,087
203,132
665,219
31View entire presentation