Sezzle Results Presentation Deck
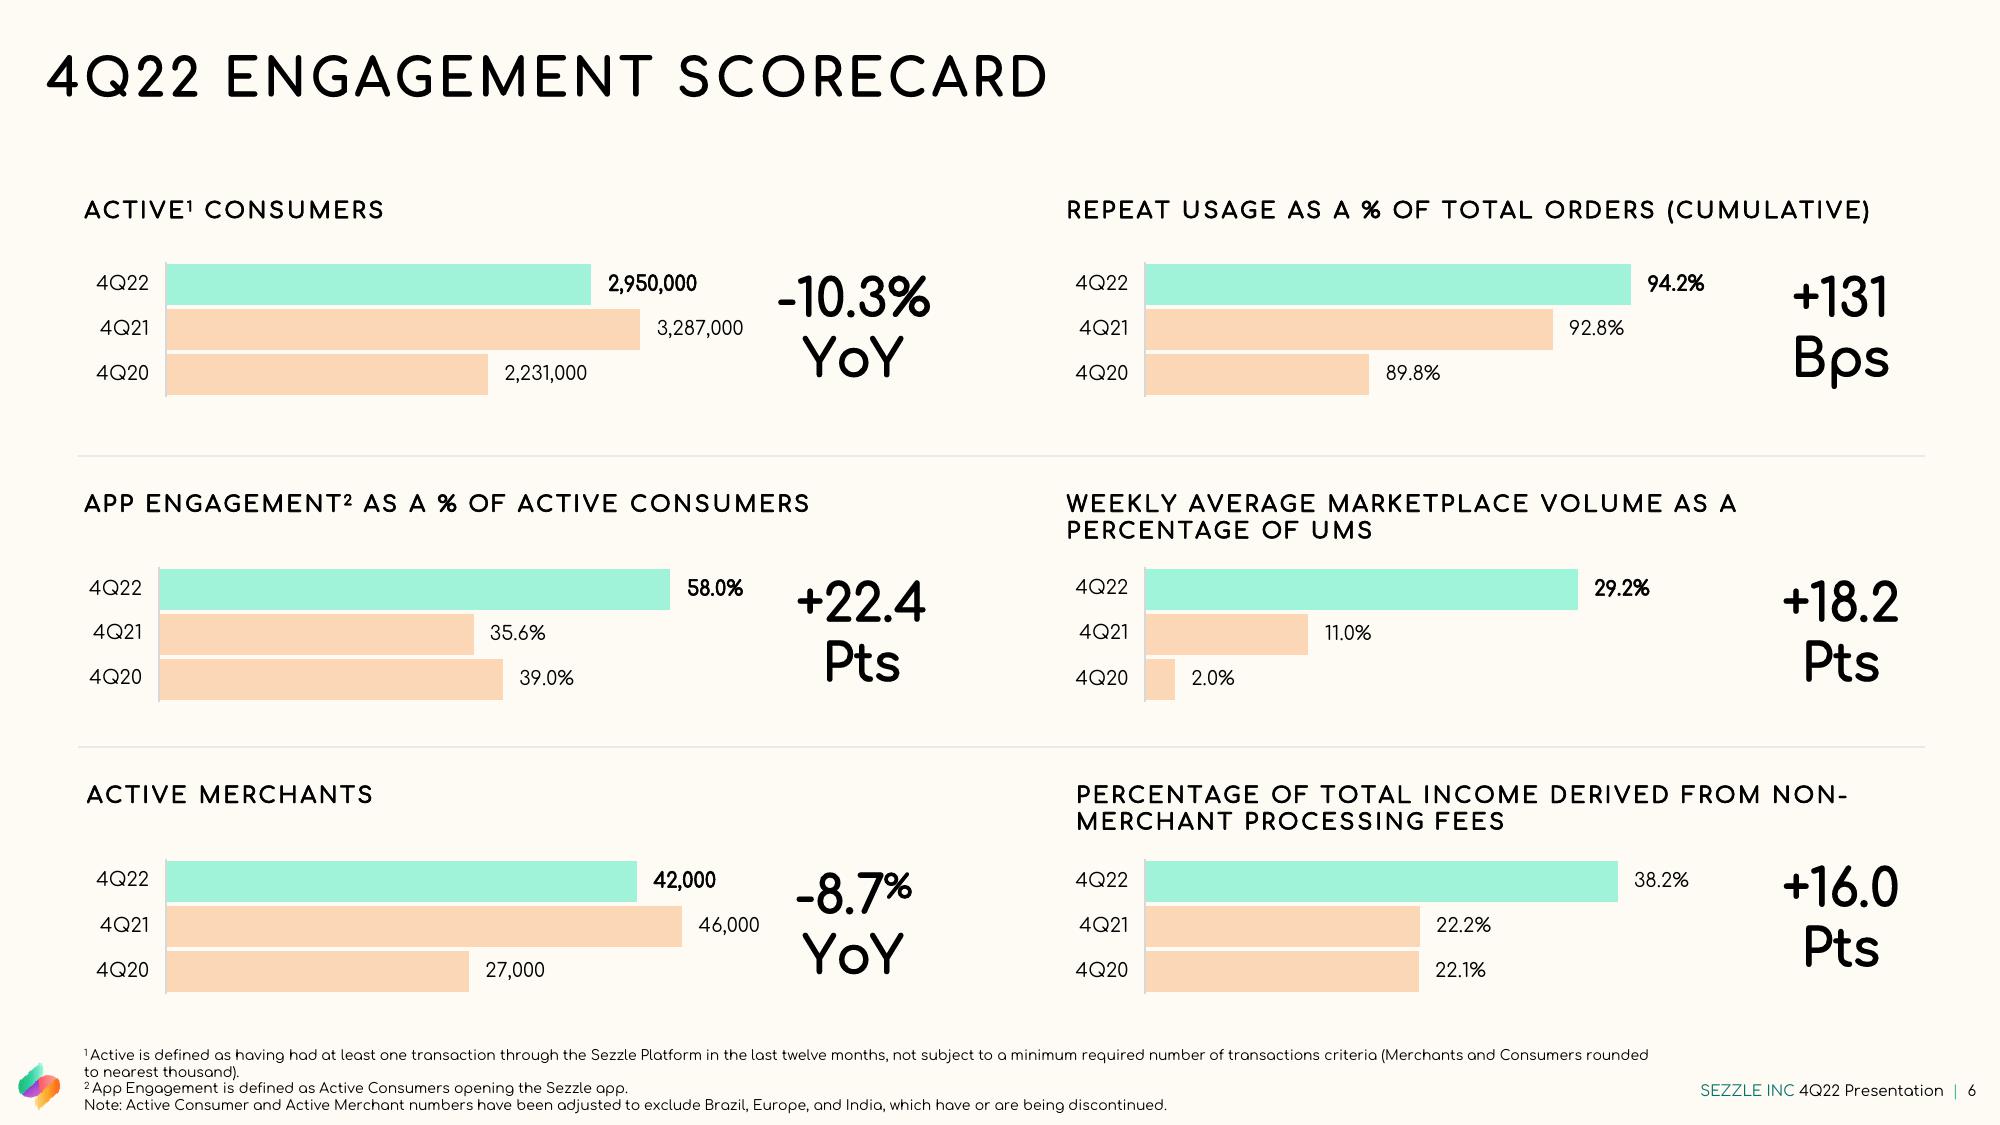
4Q22 ENGAGEMENT SCORECARD
ACTIVE¹ CONSUMERS
4Q22
4Q21
4Q20
4Q22
4Q21
4Q20
ACTIVE MERCHANTS
4Q22
2,231,000
APP ENGAGEMENT2 AS A % OF ACTIVE CONSUMERS
4Q21
4Q20
35.6%
39.0%
2,950,000
27,000
3,287,000
58.0%
42,000
-10.3%
YoY
46,000
+22.4
Pts
-8.7%
YOY
REPEAT USAGE AS A % OF TOTAL ORDERS (CUMULATIVE)
4Q22
4Q21
4Q20
4Q22
4Q21
WEEKLY AVERAGE MARKETPLACE VOLUME AS A
PERCENTAGE OF UMS
4Q20
2.0%
4Q22
4Q21
4Q20
89.8%
11.0%
92.8%
94.2%
22.2%
22.1%
29.2%
PERCENTAGE OF TOTAL INCOME DERIVED FROM NON-
MERCHANT PROCESSING FEES
38.2%
+131
Bps
¹Active is defined as having had at least one transaction through the Sezzle Platform in the last twelve months, not subject to a minimum required number of transactions criteria (Merchants and Consumers rounded
to nearest thousand).
2 App Engagement is defined as Active Consumers opening the Sezzle app.
Note: Active Consumer and Active Merchant numbers have been adjusted to exclude Brazil, Europe, and India, which have or are being discontinued.
+18.2
Pts
+16.0
Pts
SEZZLE INC 4Q22 Presentation | 6View entire presentation