Nextdoor SPAC Presentation Deck
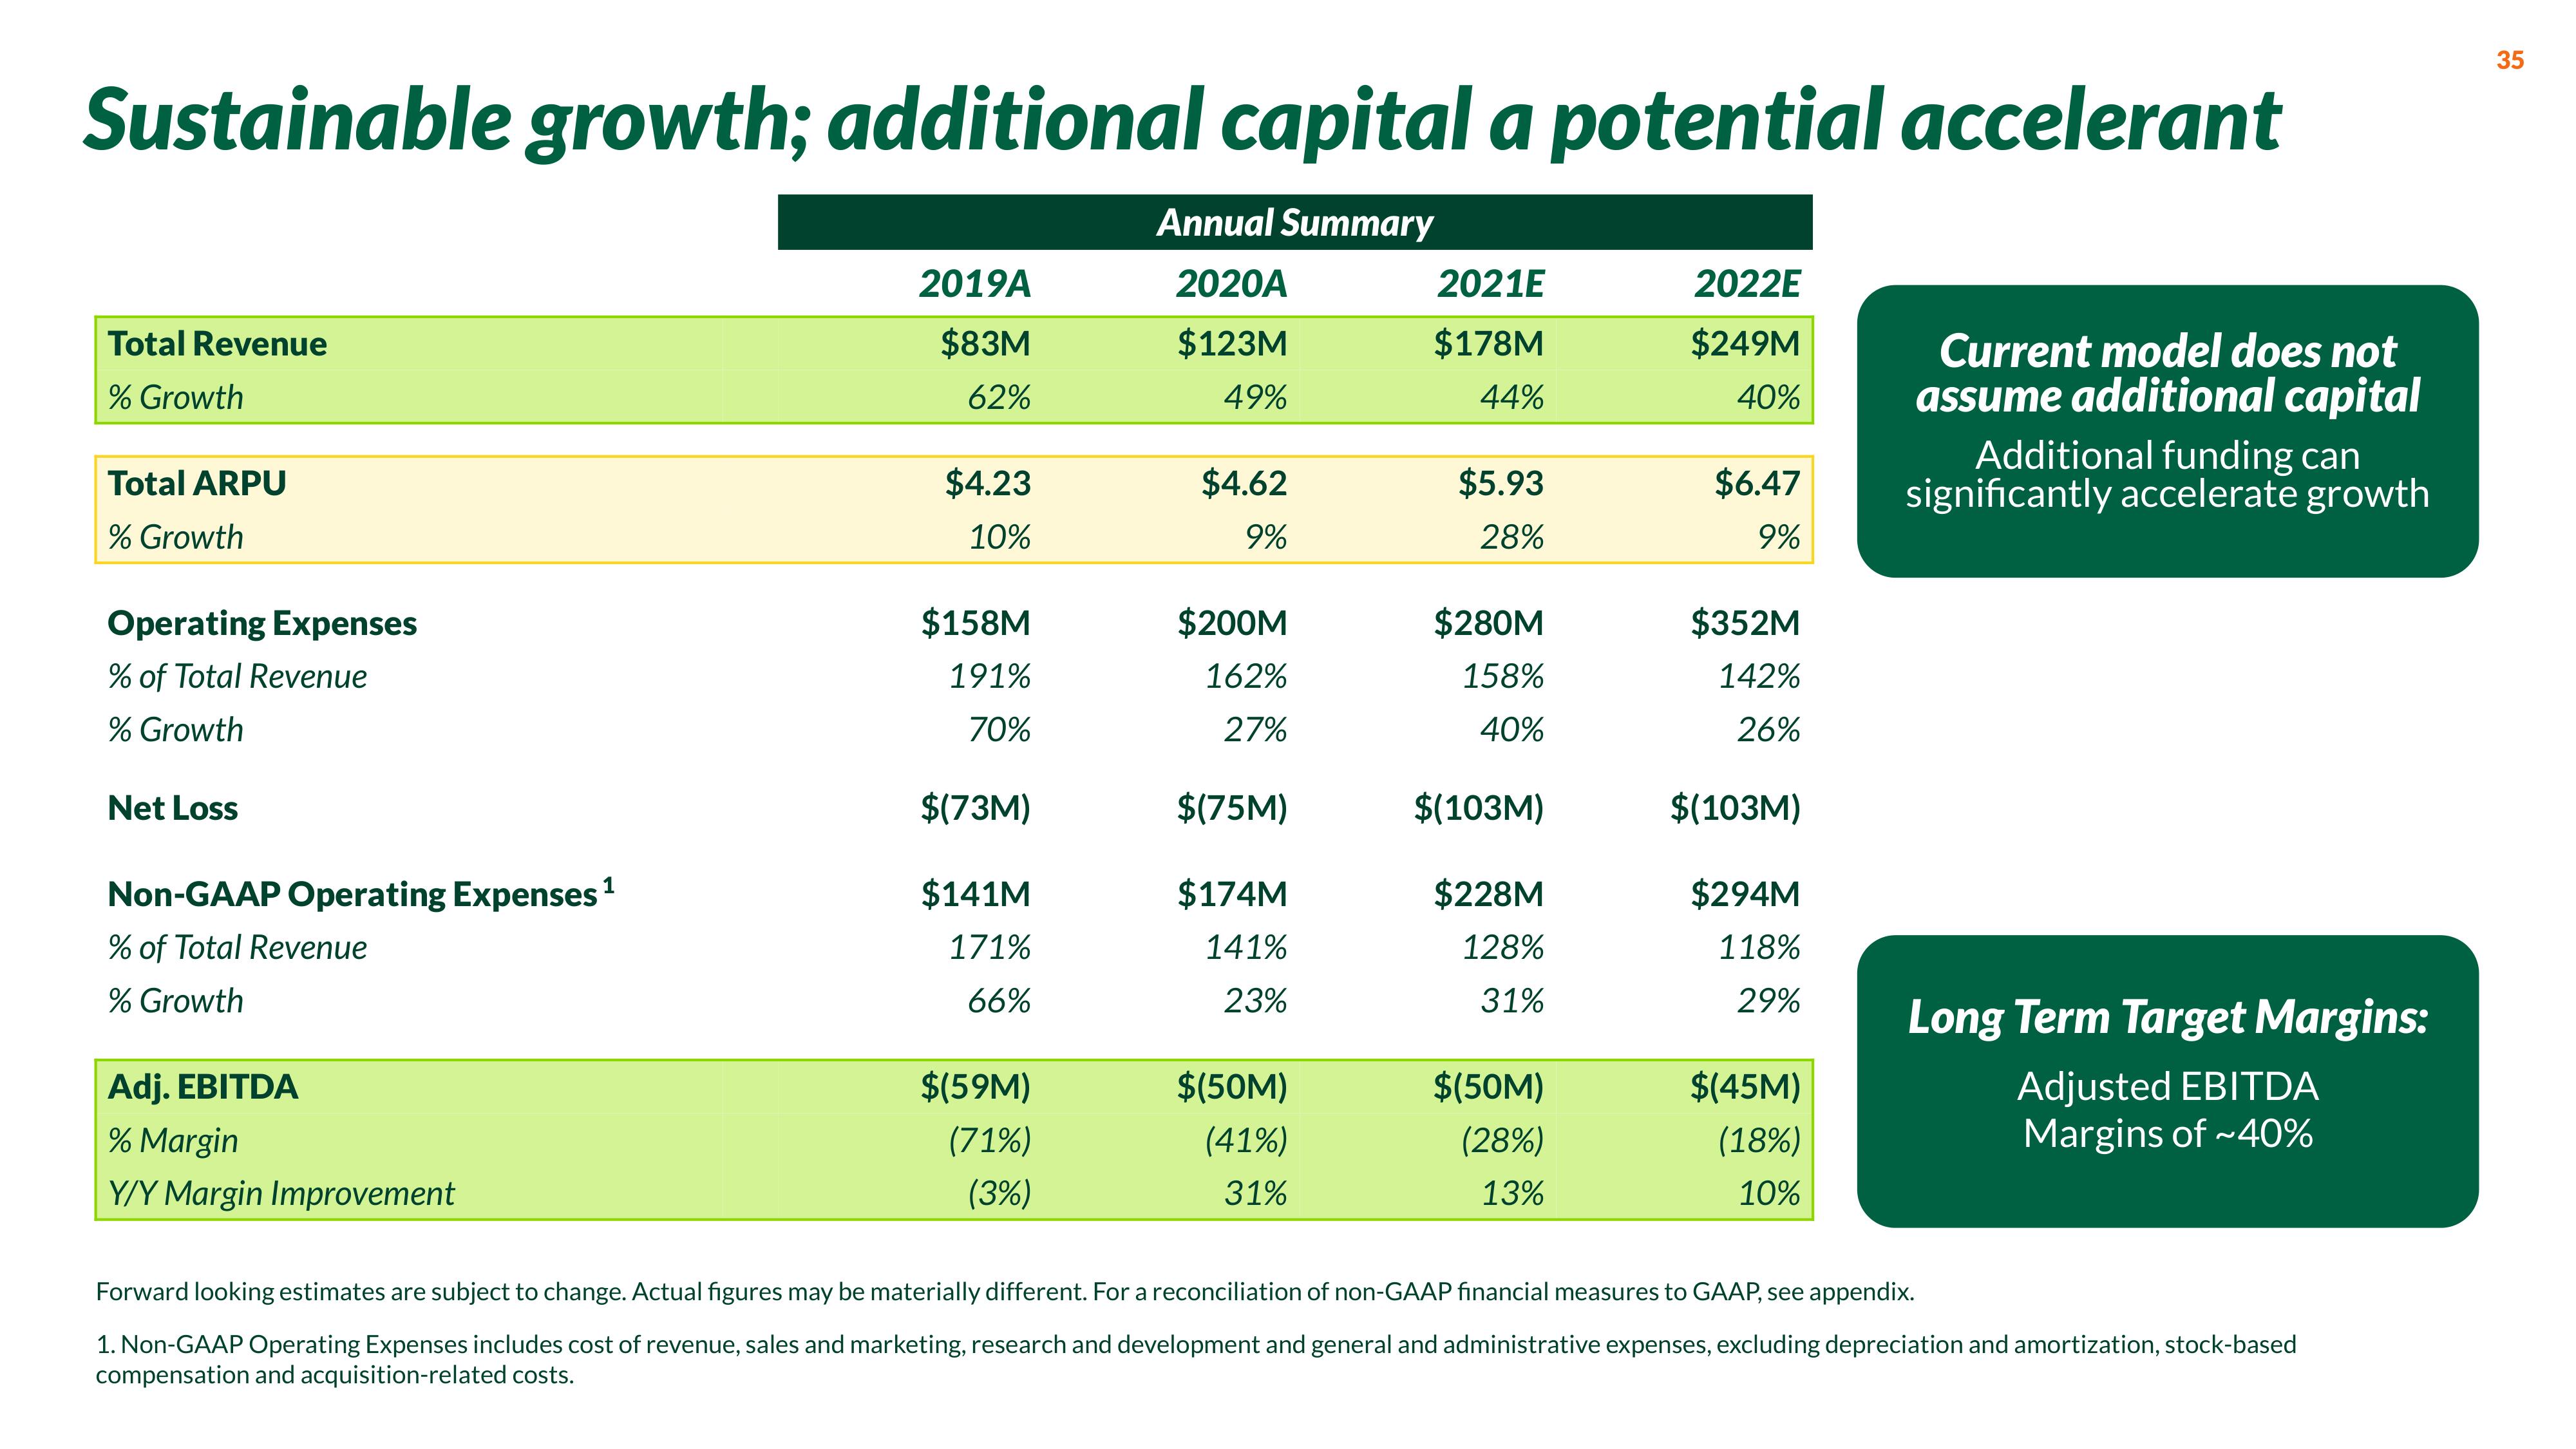
Sustainable growth; additional capital a potential accelerant
Annual Summary
2020A
$123M
49%
Total Revenue
% Growth
Total ARPU
% Growth
Operating Expenses
% of Total Revenue
% Growth
Net Loss
Non-GAAP Operating Expenses ¹
1
% of Total Revenue
% Growth
Adj. EBITDA
% Margin
Y/Y Margin Improvement
2019A
$83M
62%
$4.23
10%
$158M
191%
70%
$(73M)
$141M
171%
66%
$(59M)
(71%)
(3%)
$4.62
9%
$200M
162%
27%
$(75M)
$174M
141%
23%
$(50M)
(41%)
31%
2021E
$178M
44%
$5.93
28%
$280M
158%
40%
$(103M)
$228M
128%
31%
$(50M)
(28%)
13%
2022E
$249M
40%
$6.47
9%
$352M
142%
26%
$(103M)
$294M
118%
29%
$(45M)
(18%)
10%
Current model does not
assume additional capital
Additional funding can
significantly accelerate growth
Long Term Target Margins:
Adjusted EBITDA
Margins of ~40%
Forward looking estimates are subject to change. Actual figures may be materially different. For a reconciliation of non-GAAP financial measures to GAAP, see appendix.
1. Non-GAAP Operating Expenses includes cost of revenue, sales and marketing, research and development and general and administrative expenses, excluding depreciation and amortization, stock-based
compensation and acquisition-related costs.
35View entire presentation