Uber Results Presentation Deck
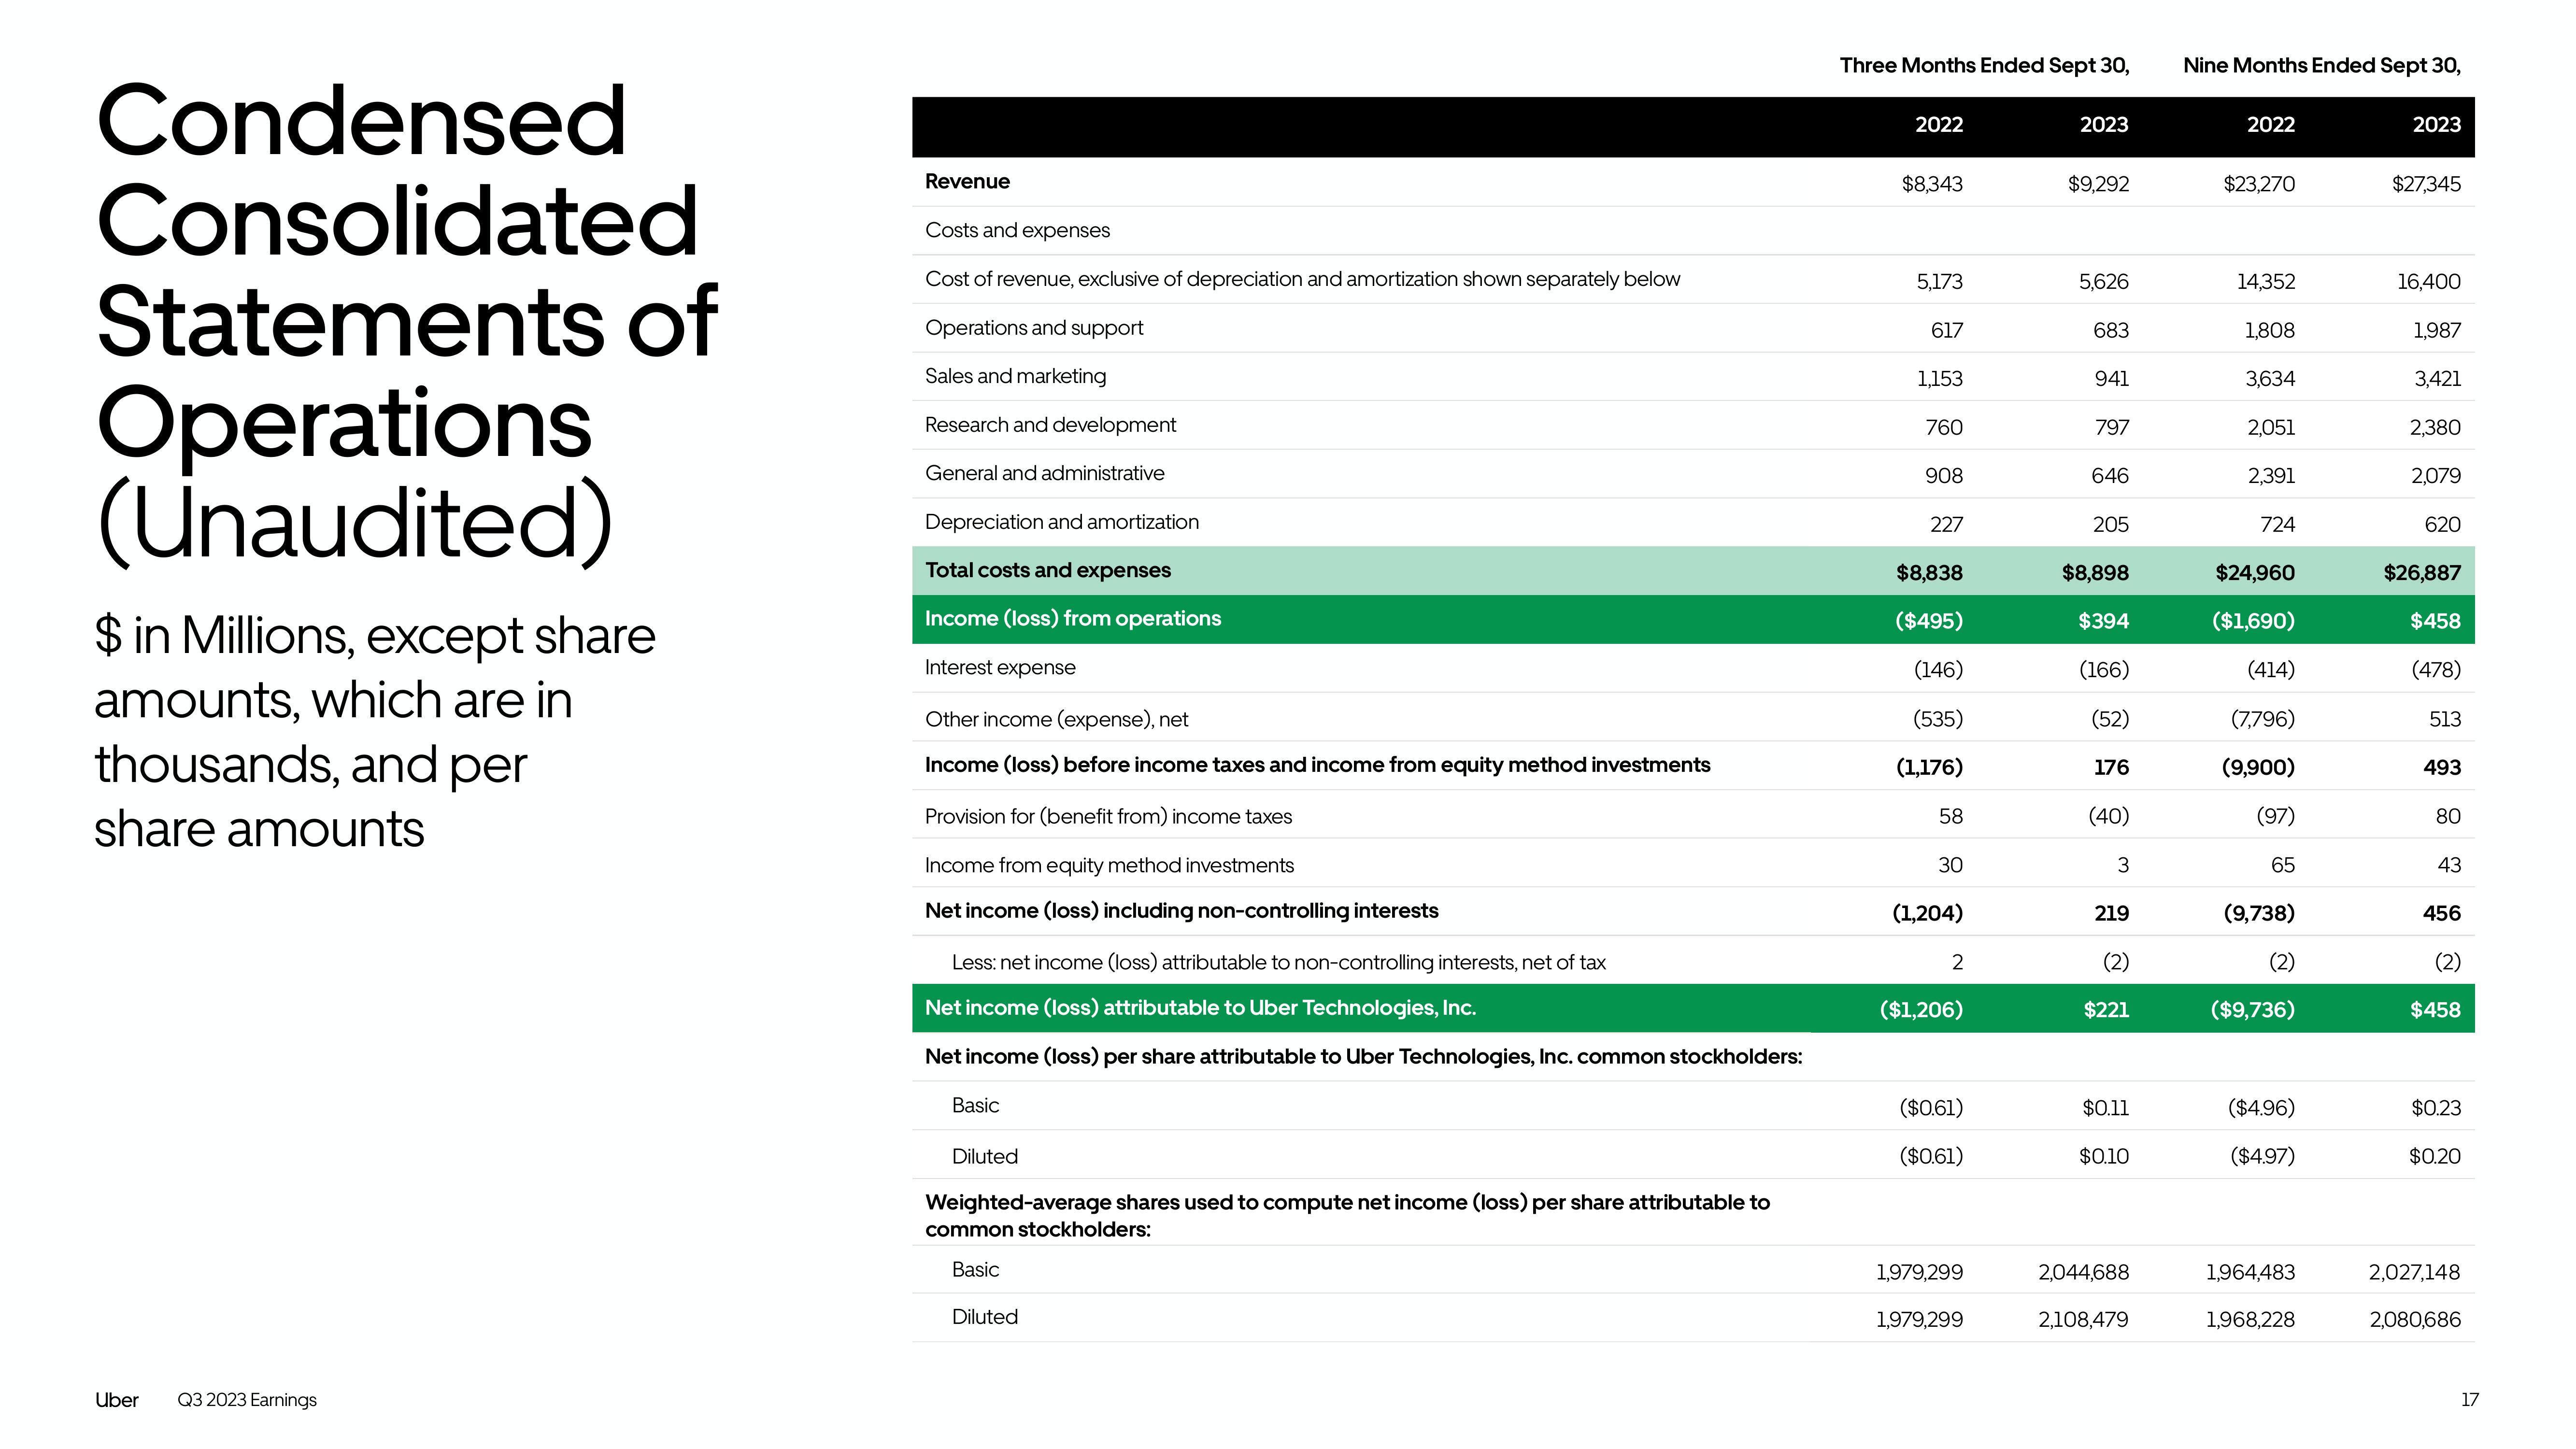
Condensed
Consolidated
Statements of
Operations
(Unaudited)
$ in Millions, except share
amounts, which are in
thousands, and per
share amounts
Uber Q3 2023 Earnings
Revenue
Costs and expenses
Cost of revenue, exclusive of depreciation and amortization shown separately below
Operations and support
Sales and marketing
Research and development
General and administrative
Depreciation and amortization
Total costs and expenses
Income (loss) from operations
Interest expense
Other income (expense), net
Income (loss) before income taxes and income from equity method investments
Provision for (benefit from) income taxes
Income from equity method investments
Net income (loss) including non-controlling interests
Less: net income (loss) attributable to non-controlling interests, net of tax
Net income (loss) attributable to Uber Technologies, Inc.
Net income (loss) per share attributable to Uber Technologies, Inc. common stockholders:
Basic
Diluted
Weighted-average shares used to compute net income (loss) per share attributable to
common stockholders:
Basic
Diluted
Three Months Ended Sept 30,
2022
$8,343
5,173
617
1,153
760
908
227
$8,838
($495)
(146)
(535)
(1,176)
58
30
(1,204)
2
($1,206)
($0.61)
($0.61)
1,979,299
1,979,299
2023
$9,292
5,626
683
941
797
646
205
$8,898
$394
(166)
(52)
176
(40)
3
219
(2)
$221
$0.11
$0.10
2,044,688
2,108,479
Nine Months Ended Sept 30,
2022
$23,270
14,352
1,808
3,634
2,051
2,391
724
$24,960
($1,690)
(414)
(7,796)
(9,900)
(97)
65
(9,738)
(2)
($9,736)
($4.96)
($4.97)
1,964,483
1,968,228
2023
$27,345
16,400
1,987
3,421
2,380
2,079
620
$26,887
$458
(478)
513
493
80
43
456
(2)
$458
$0.23
$0.20
2,027,148
2,080,686
17View entire presentation